
16 Sep, 2026
Posted on 16 Sep, 2026 by Mihir Khot, Posted in Dynamics-365 Sales Dynamics 365
 Blogs
Blogs
How to Build Multi-Table Hierarchies in Dynamics 365 Sales
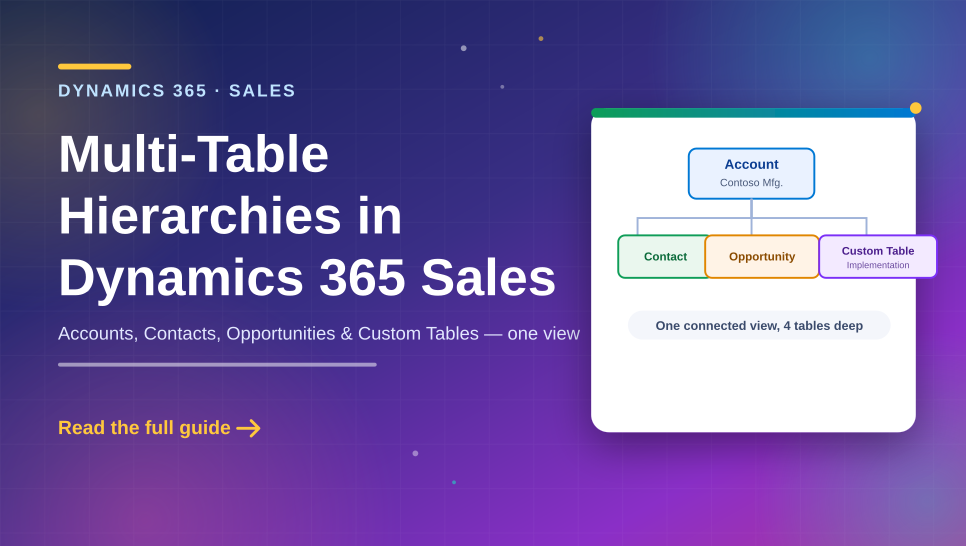
Dynamics 365 Sales has always supported hierarchies, but until recently they were limited to a single, self-referential table - think Account → Parent Account. With the new Hierarchical Relationship Visualizer, introduced in the 2025 release wave 2, admins can now build hierarchies that span multiple tables, such as Account → Contact → Opportunity → Custom Table. This gives sellers a single, connected view of a customer's people, deals, and related business data - instead of jumping between separate subgrids and views. This blog walks through building one, end to end.
A software company tracks Accounts, their Contacts, and Opportunities - and once a deal is won, a custom Implementation Project table tracks delivery. We'll build: Account → Contact → Opportunity → Implementation Project, so a seller can see a customer's people, deals, and delivery status in one view instead of four separate screens.
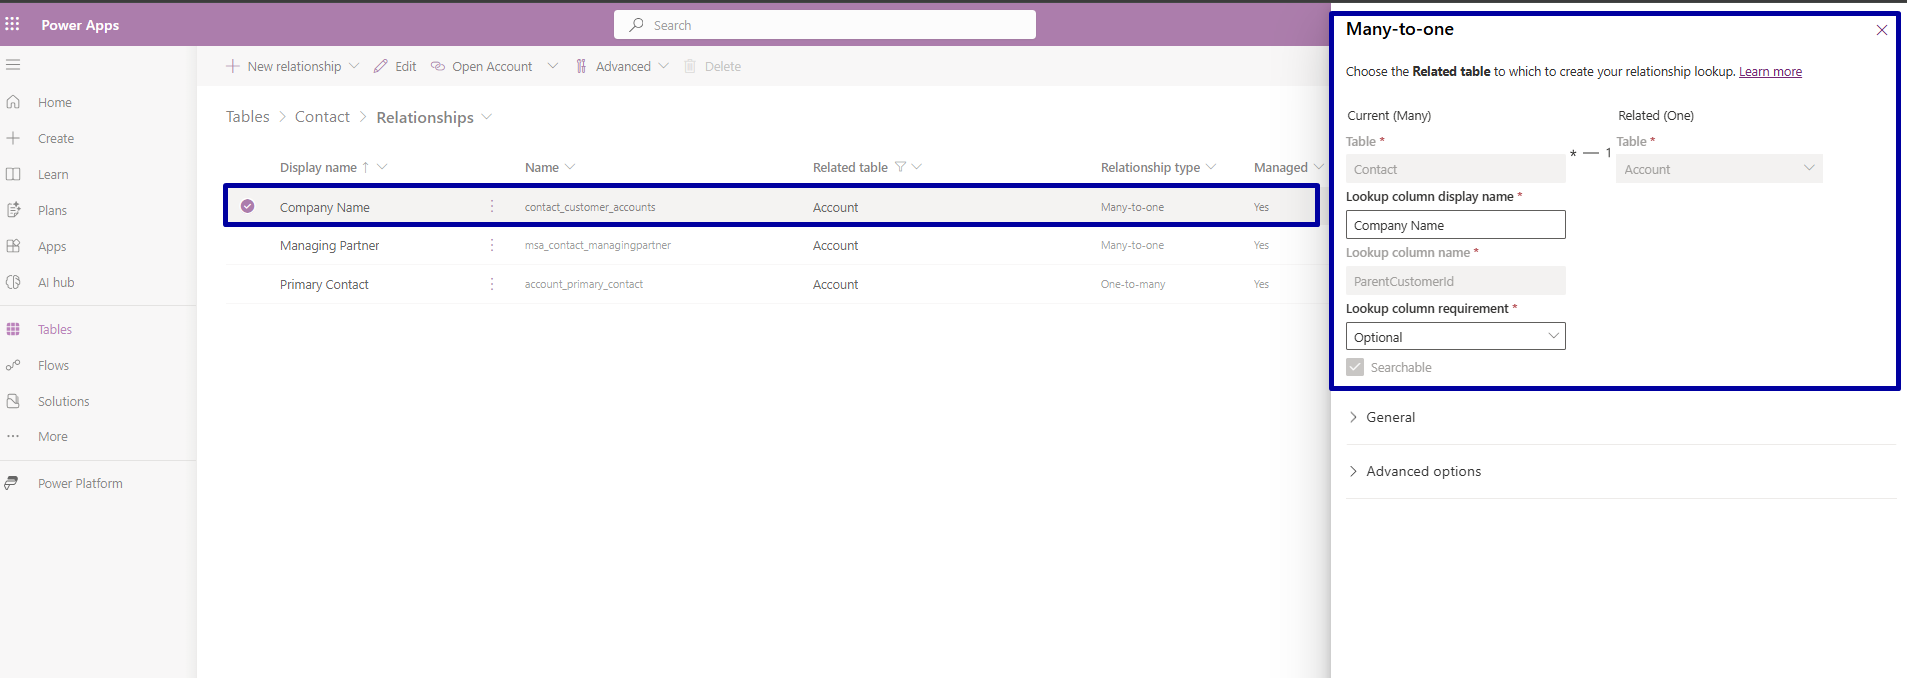
1. Confirm the standard relationships
Verify the out-of-the-box Account → Contact (parentcustomerid) and Account → Opportunity (customerid) relationships already exist in Dataverse.
2. Create the custom table
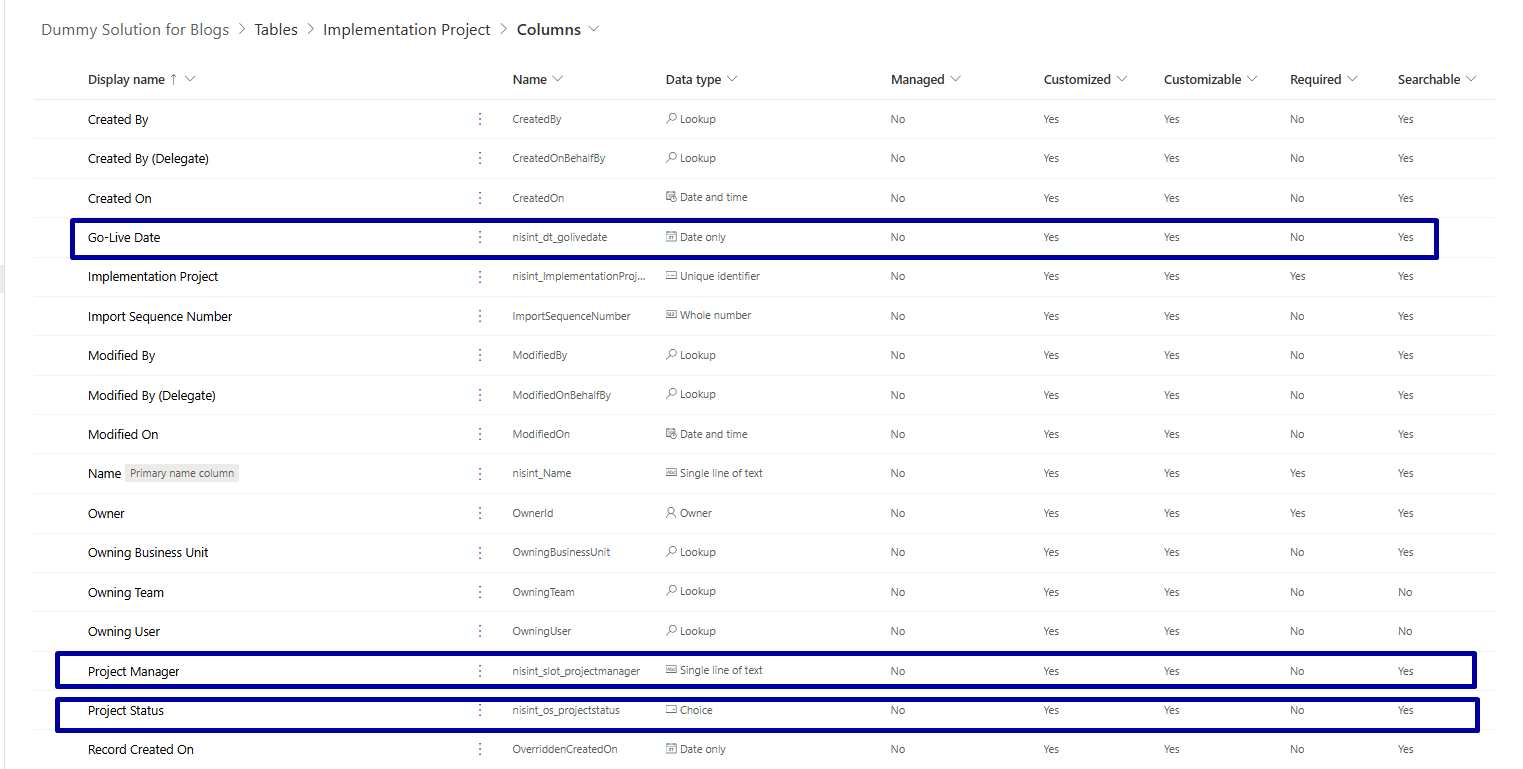
Create an Implementation Project table with Go-Live Date, Project Status, and Project Manager columns to track post-sale delivery.
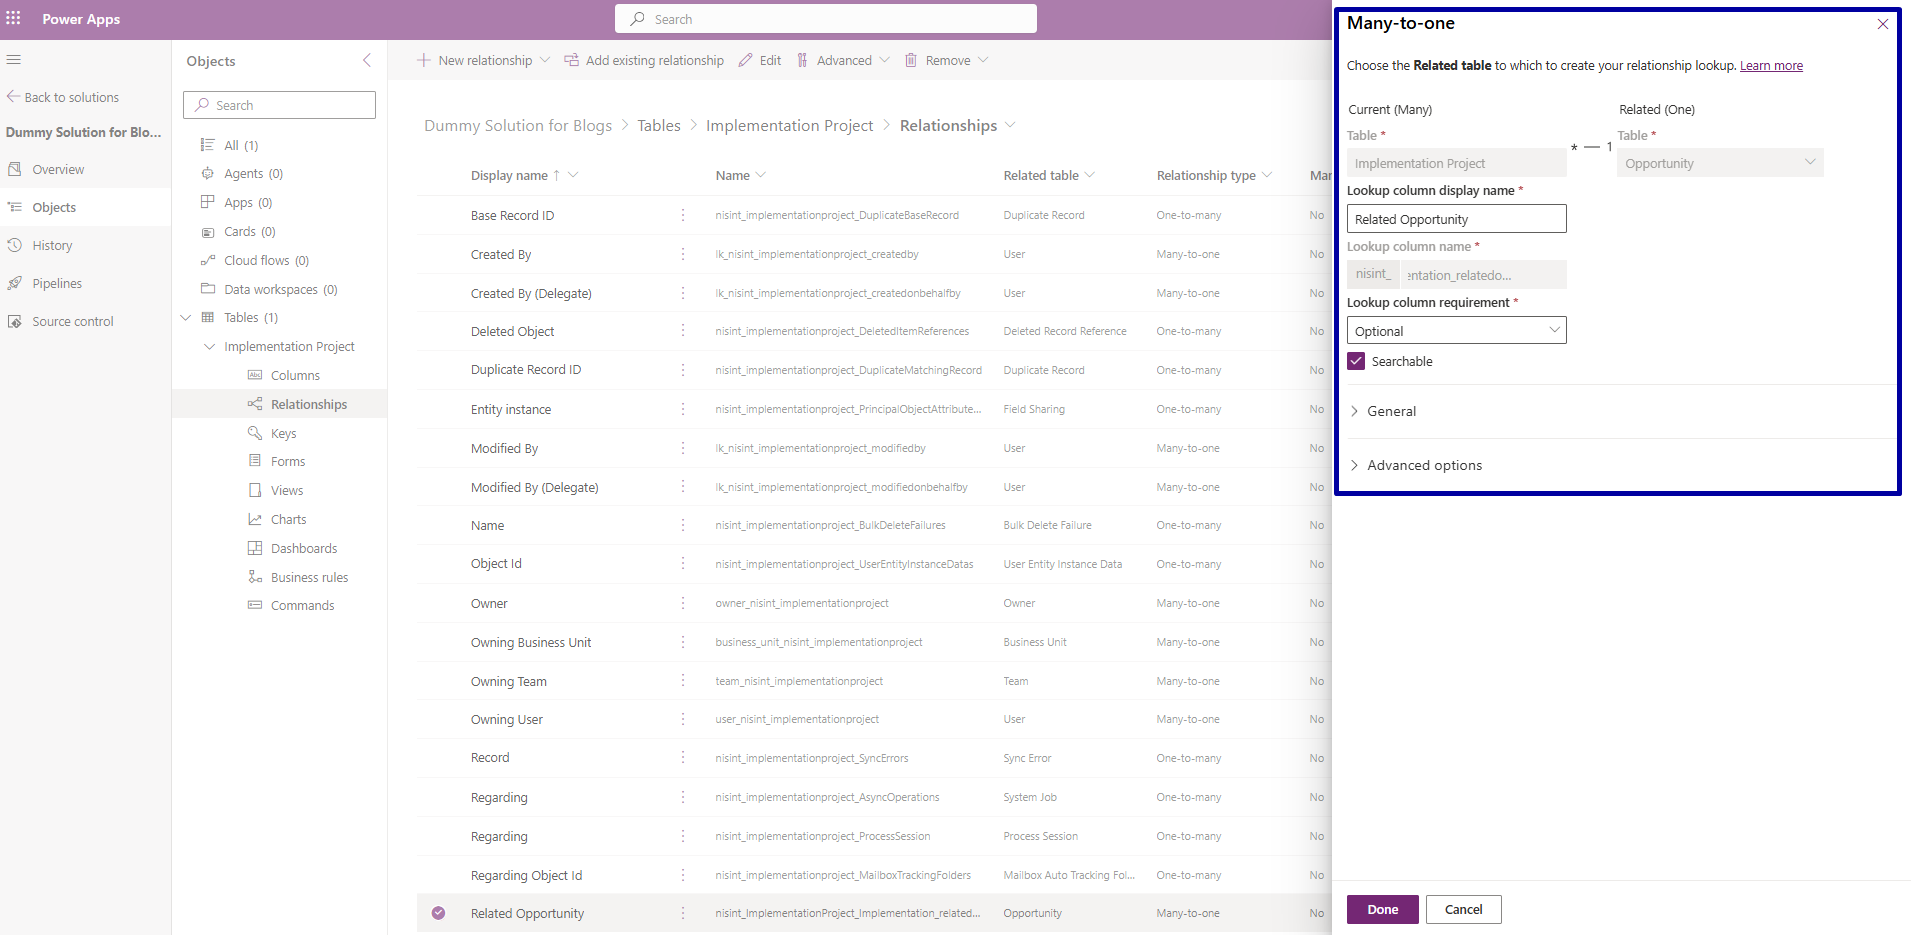
3. Link it to Opportunity
Add a many-to-one relationship from Implementation Project to Opportunity so each project ties back to the deal that created it.
4. Build a tile form for each table
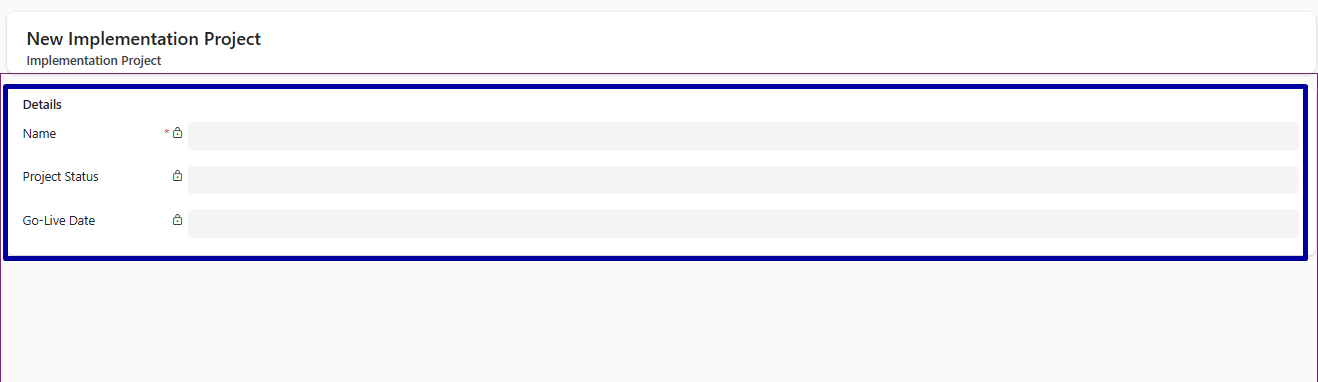
Create a Quick View Form per table (max 7 fields) to control exactly what shows on each hierarchy tile. First is the custom table form (Implementation Project Tile Form) created as shown below.
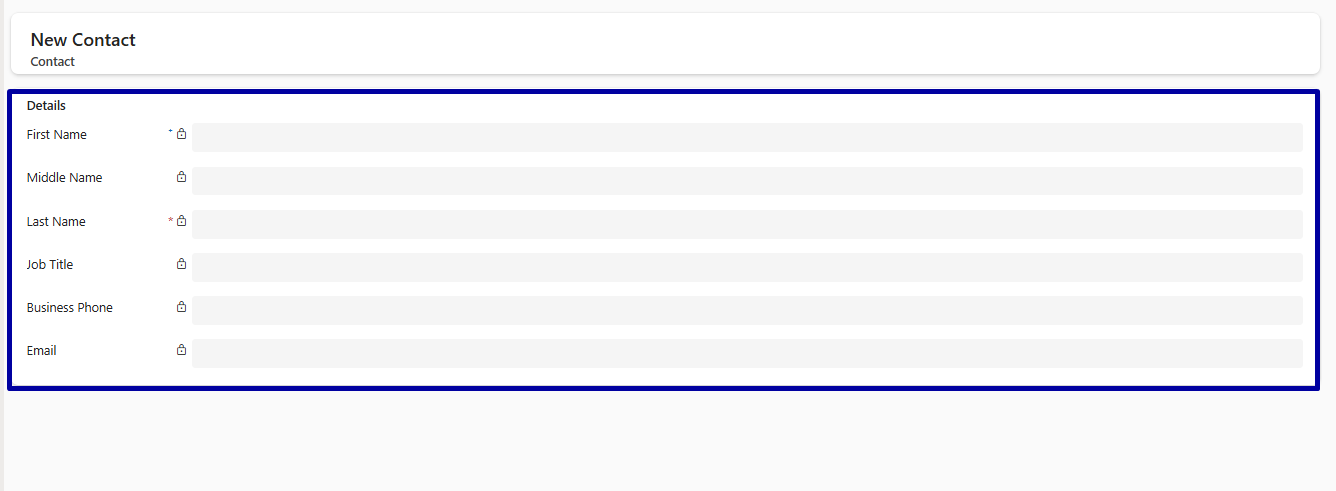
Contact Tile Form - created next, showing Full Name, Job Title, Business Phone, and Email.
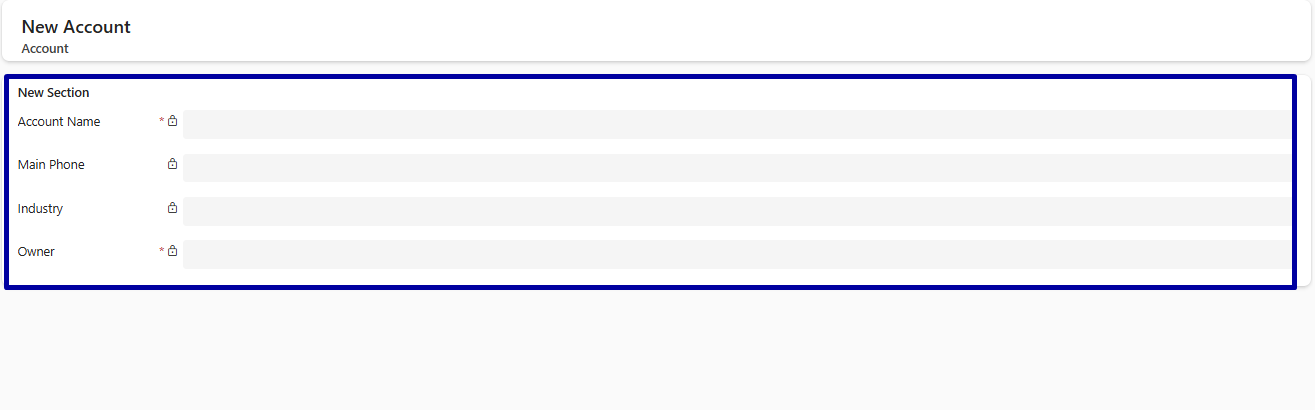
Account Tile Form - created after that, showing Account Name, Main Phone, Industry, and Owner.
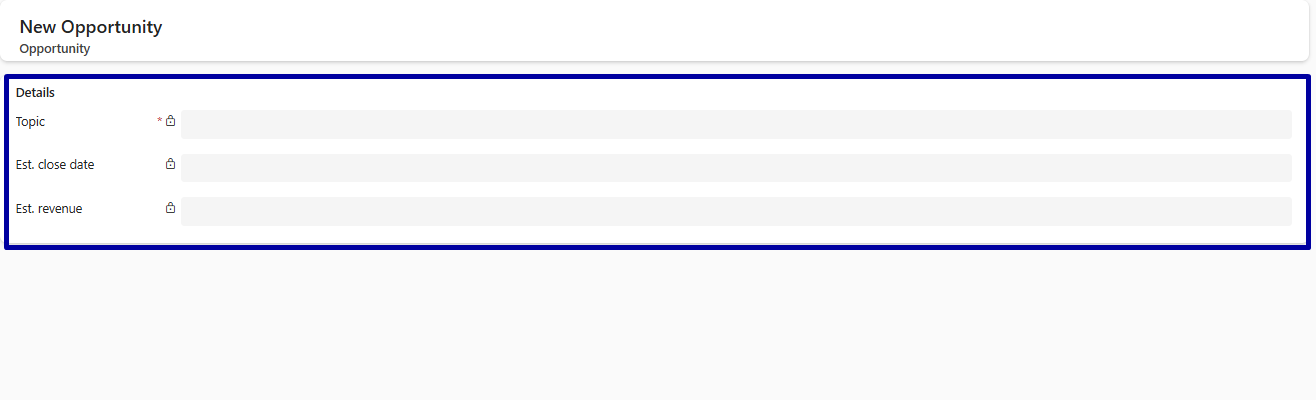
Opportunity Tile Form - created last, showing Topic, Est. Close Date, and Est. Revenue.
5. Open the hierarchy designer
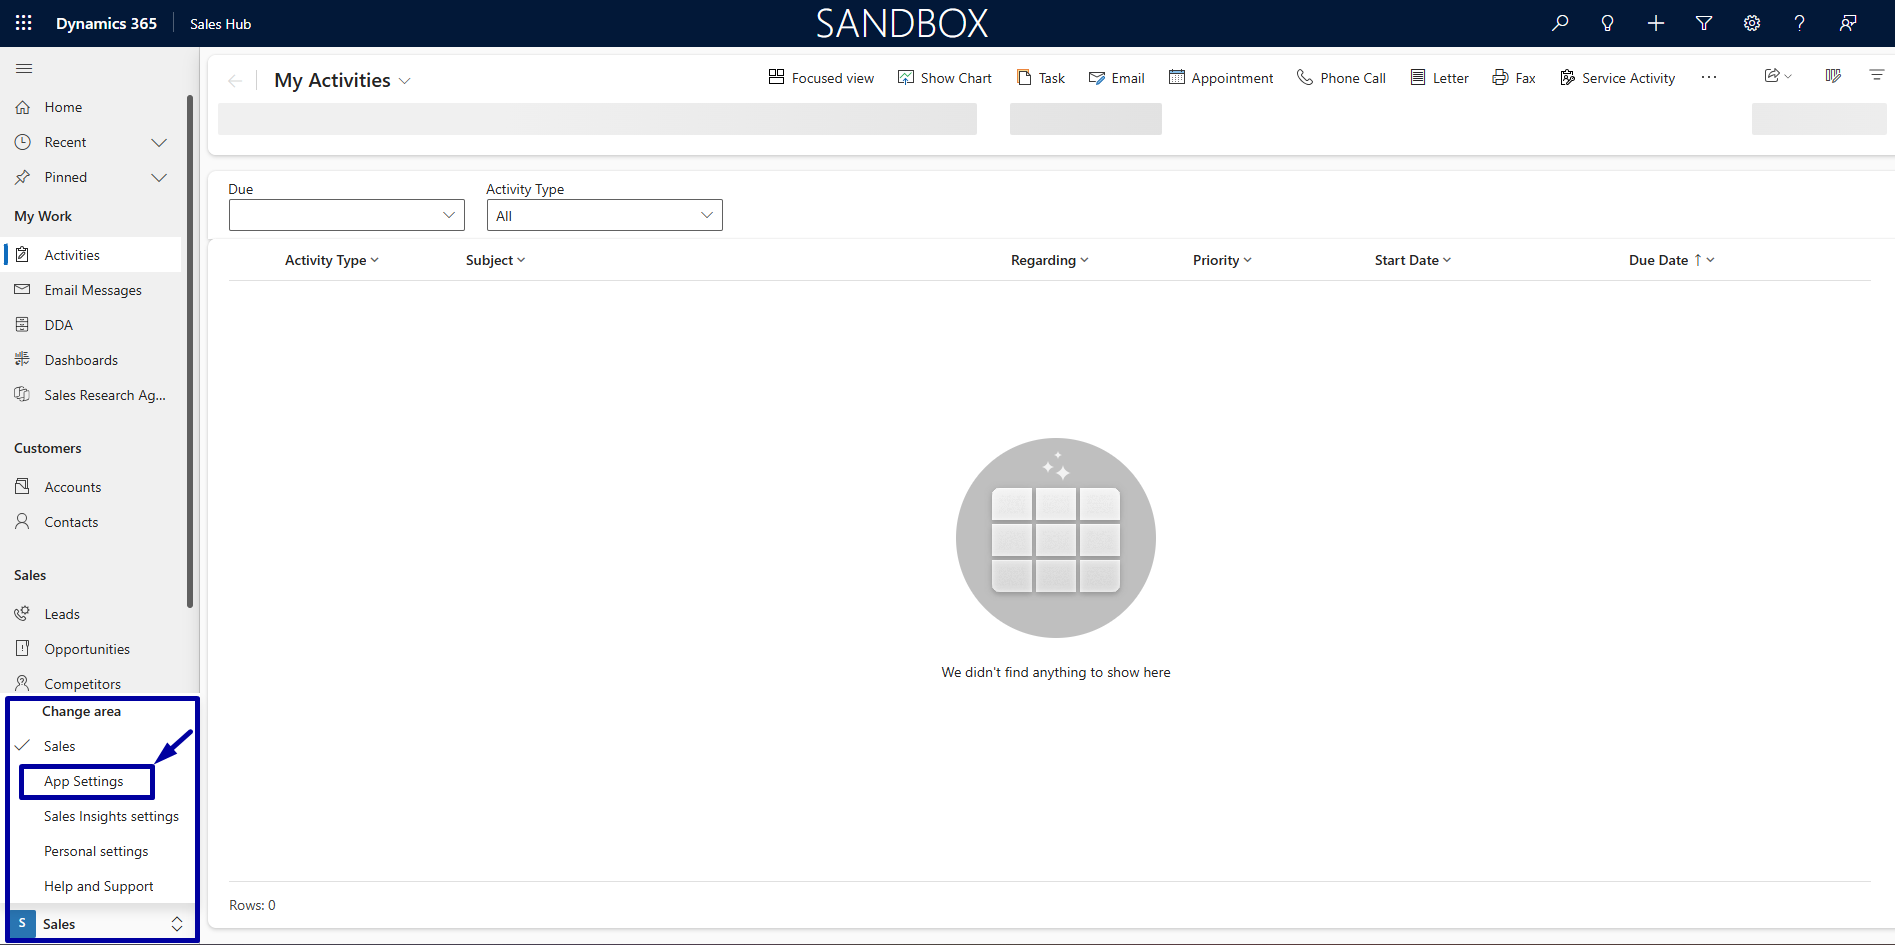
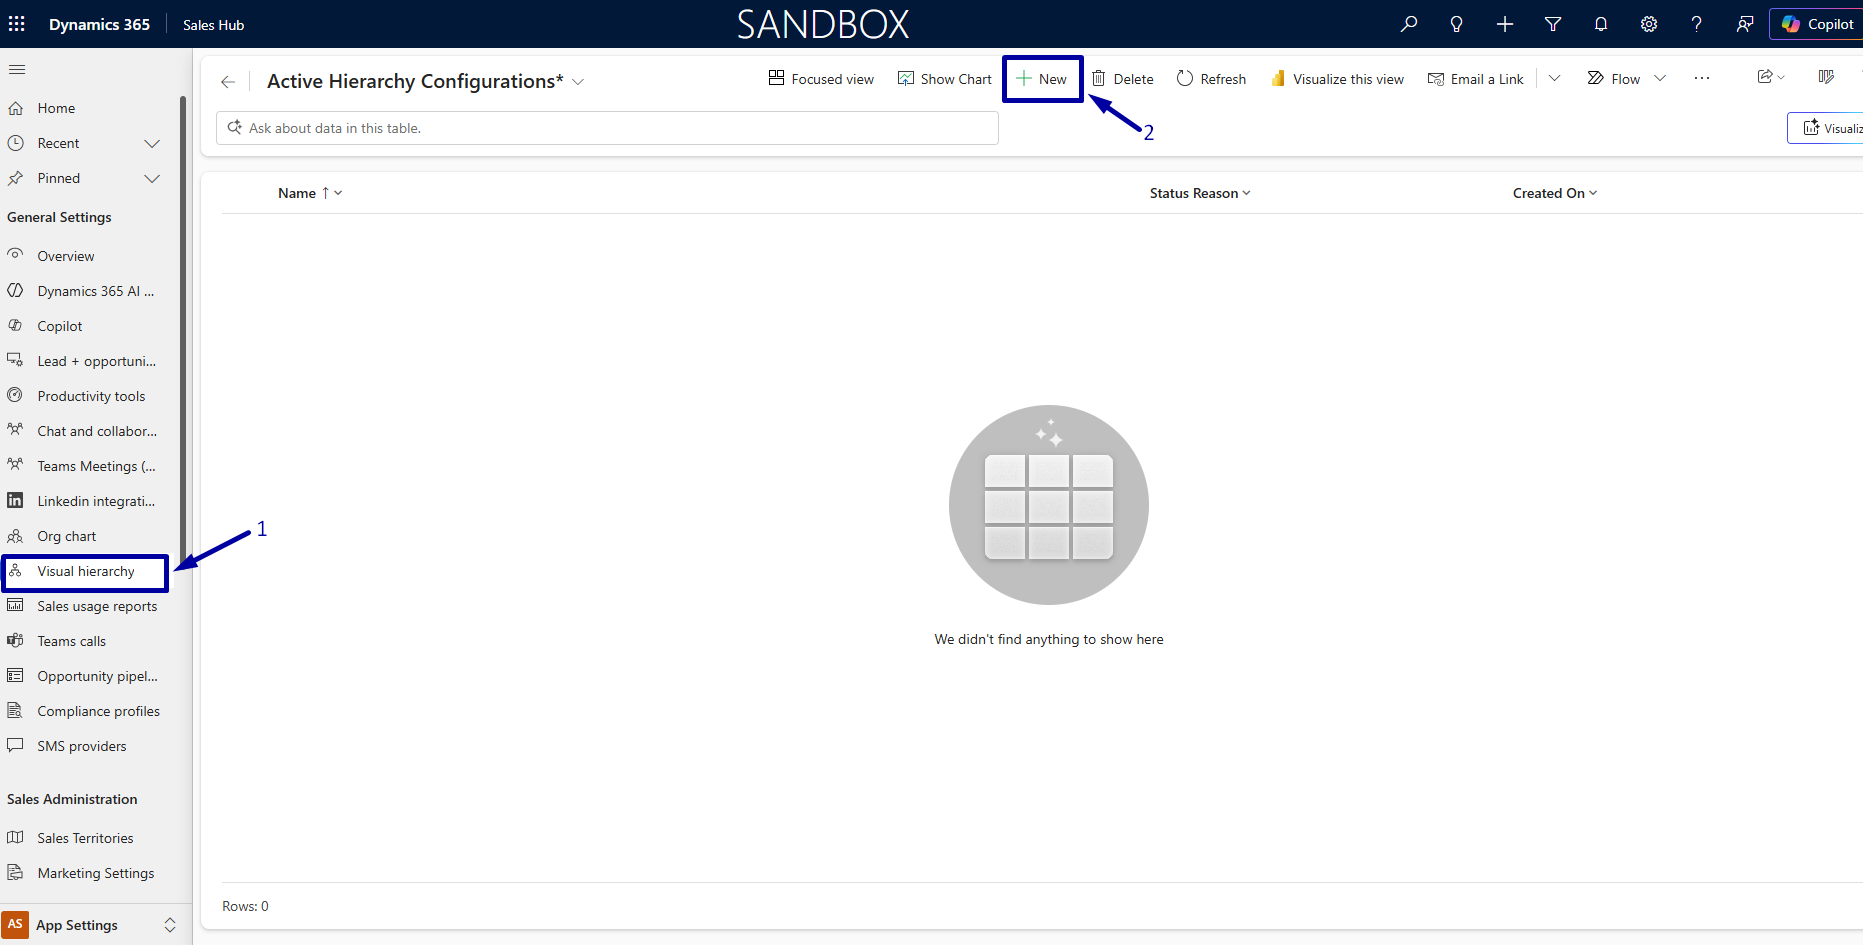
In Sales Hub, go to App Settings → General Settings → Visual hierarchy and create a new hierarchy.
6. Add Account as the root
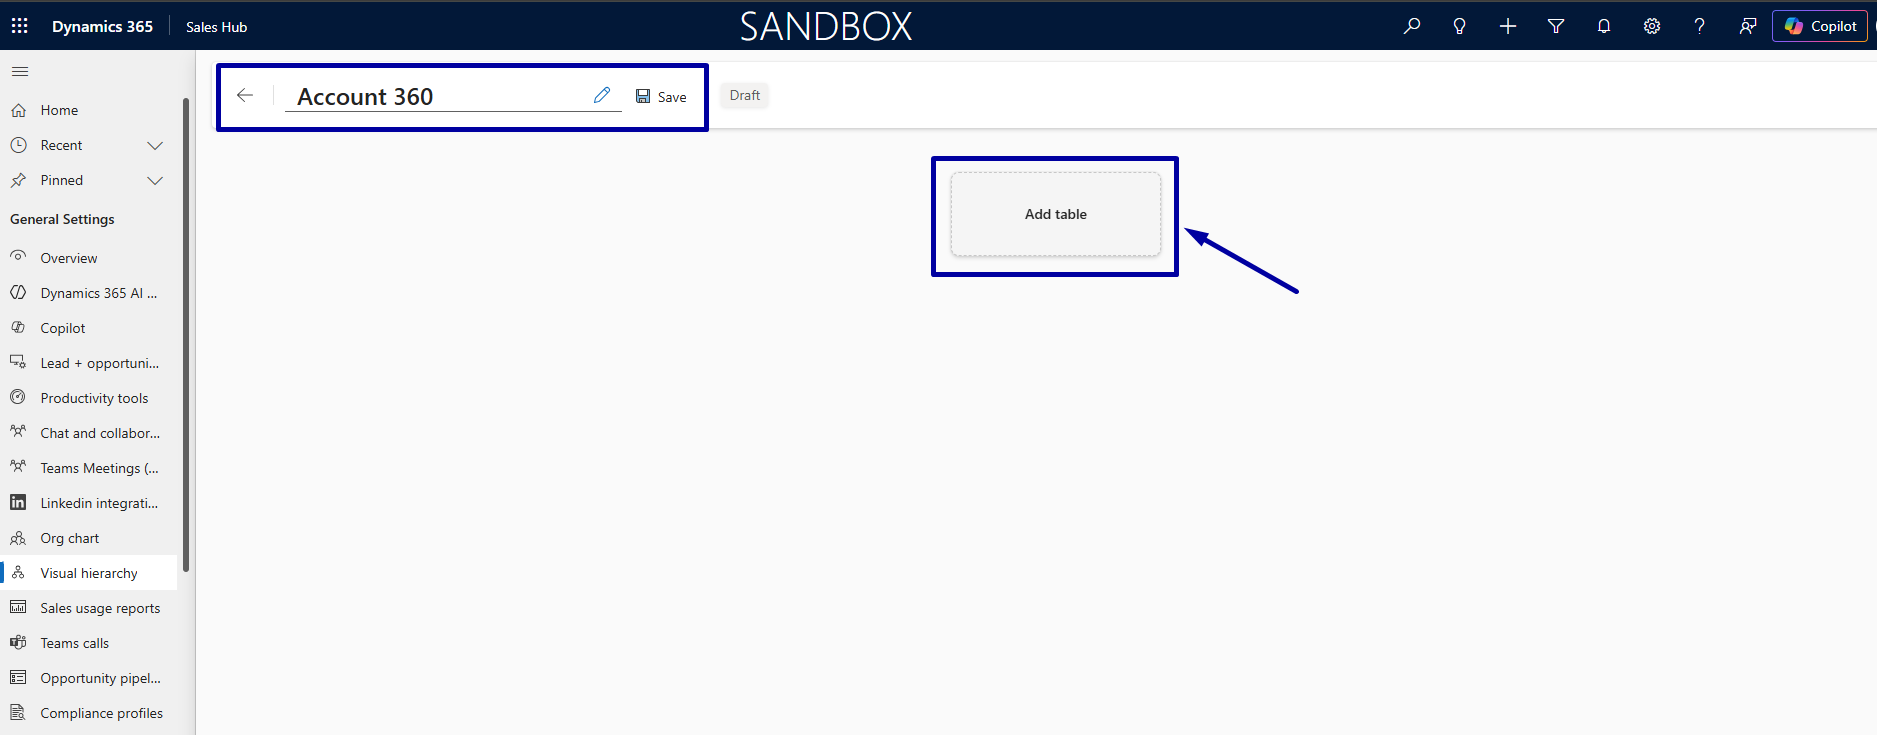
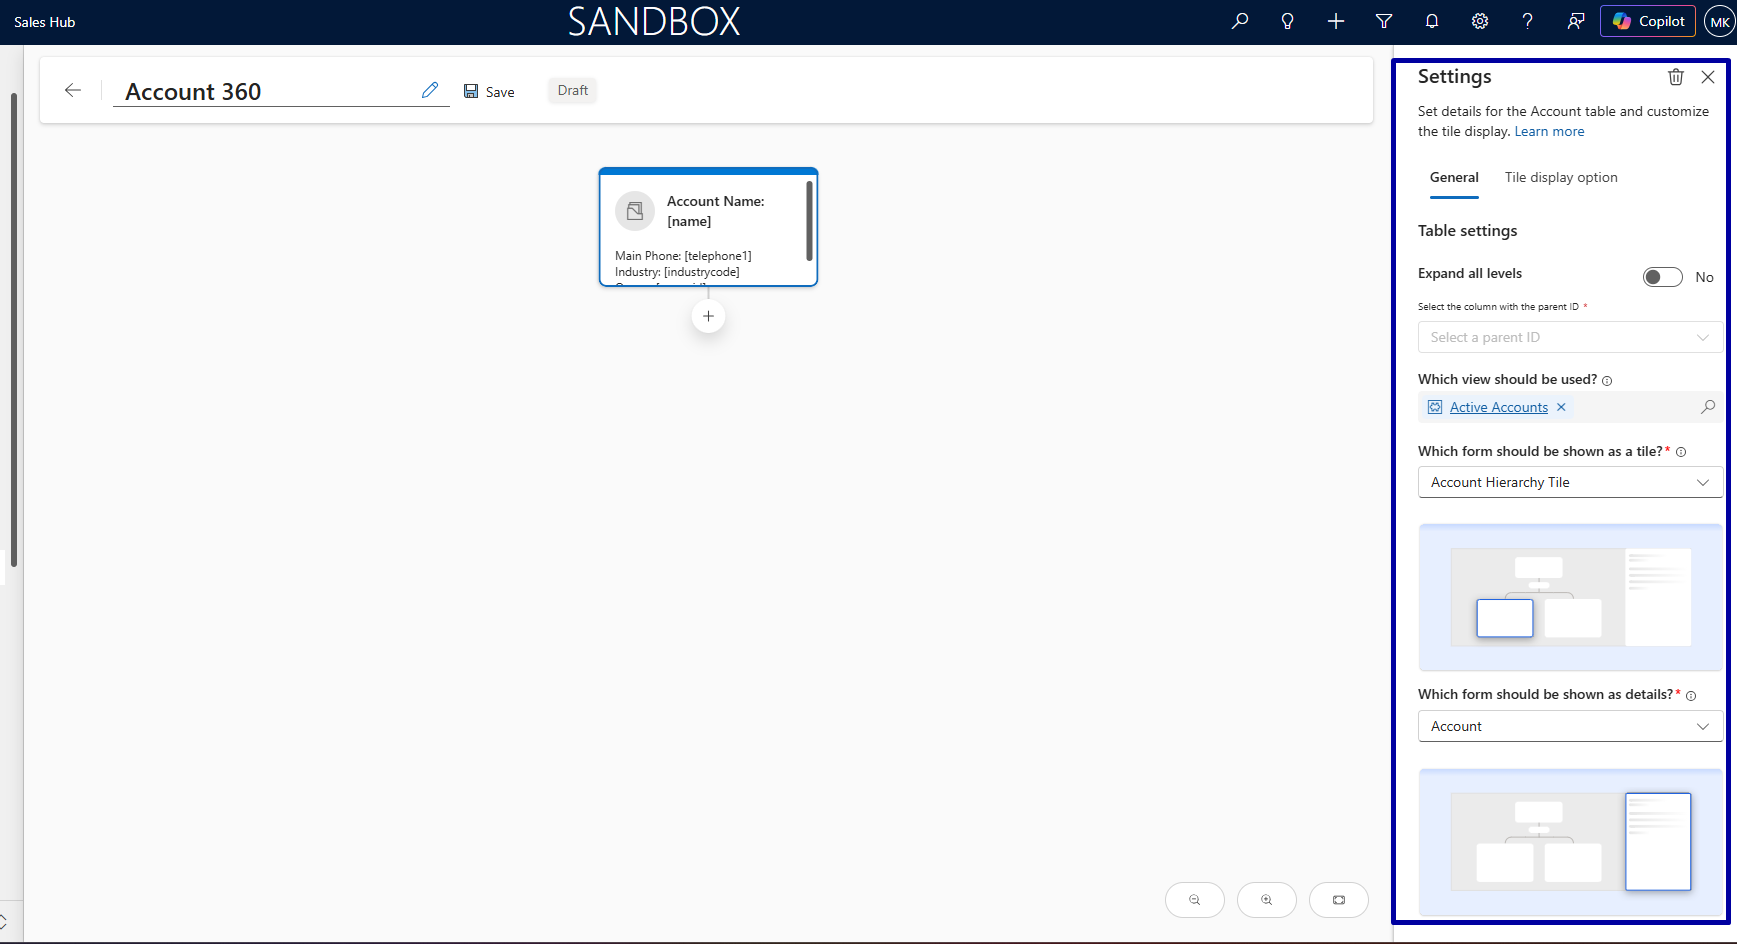
Add Account as the root node and set its view, tile form, and details form in the Settings pane.
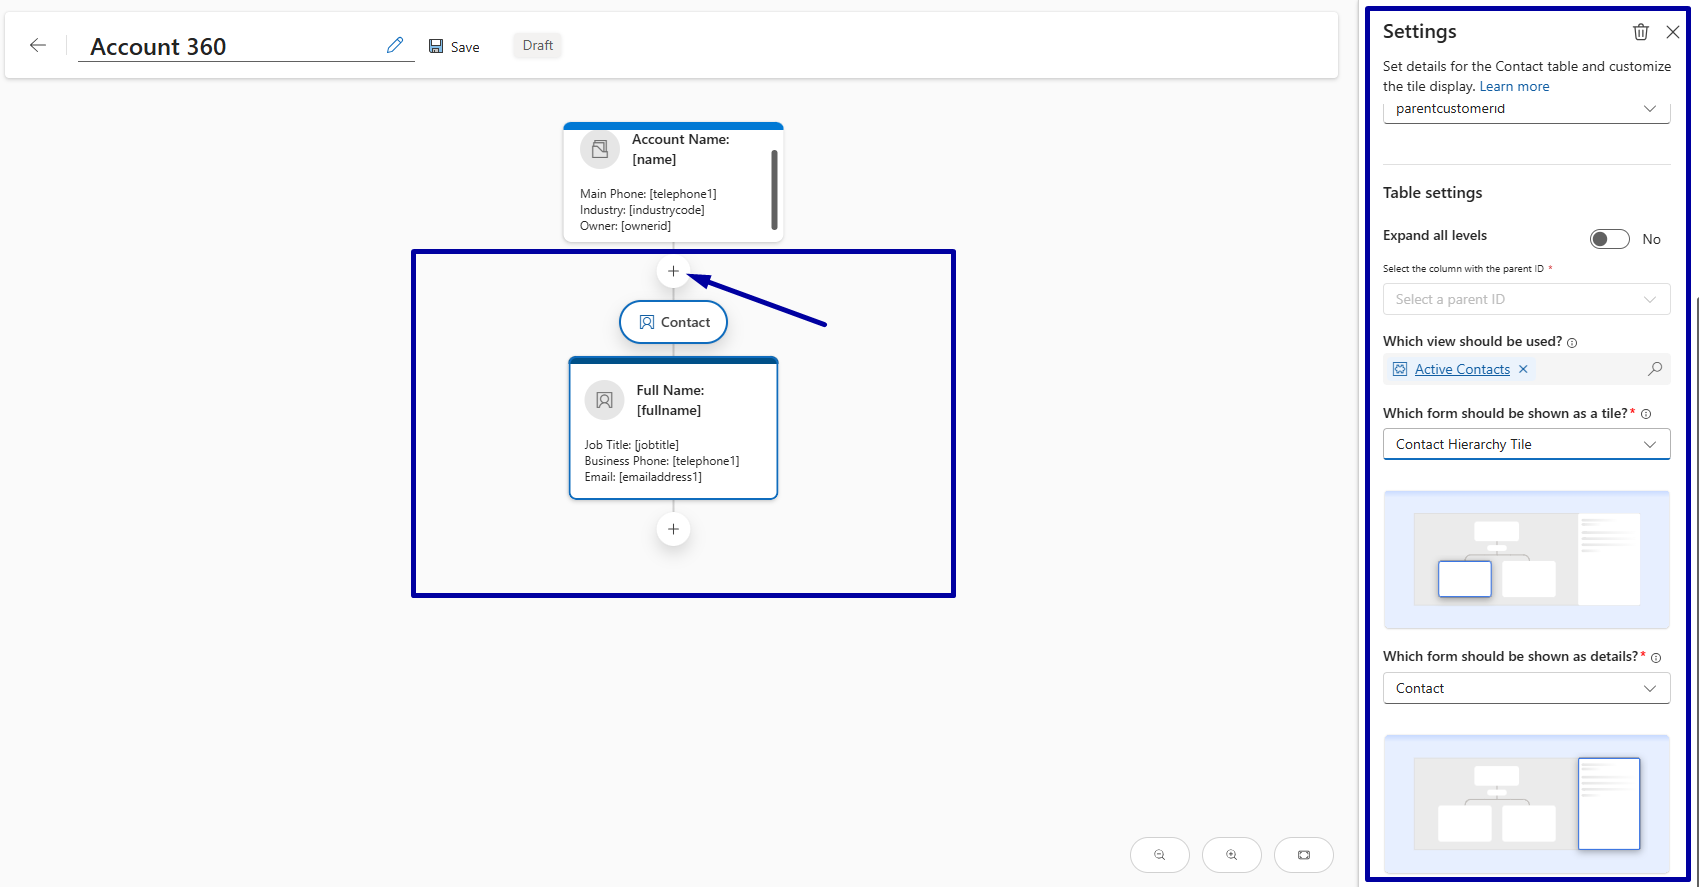
7. Add Contact under Account
Add Contact as a child node, using the Company Name (parentcustomerid) relationship so every related contact appears.
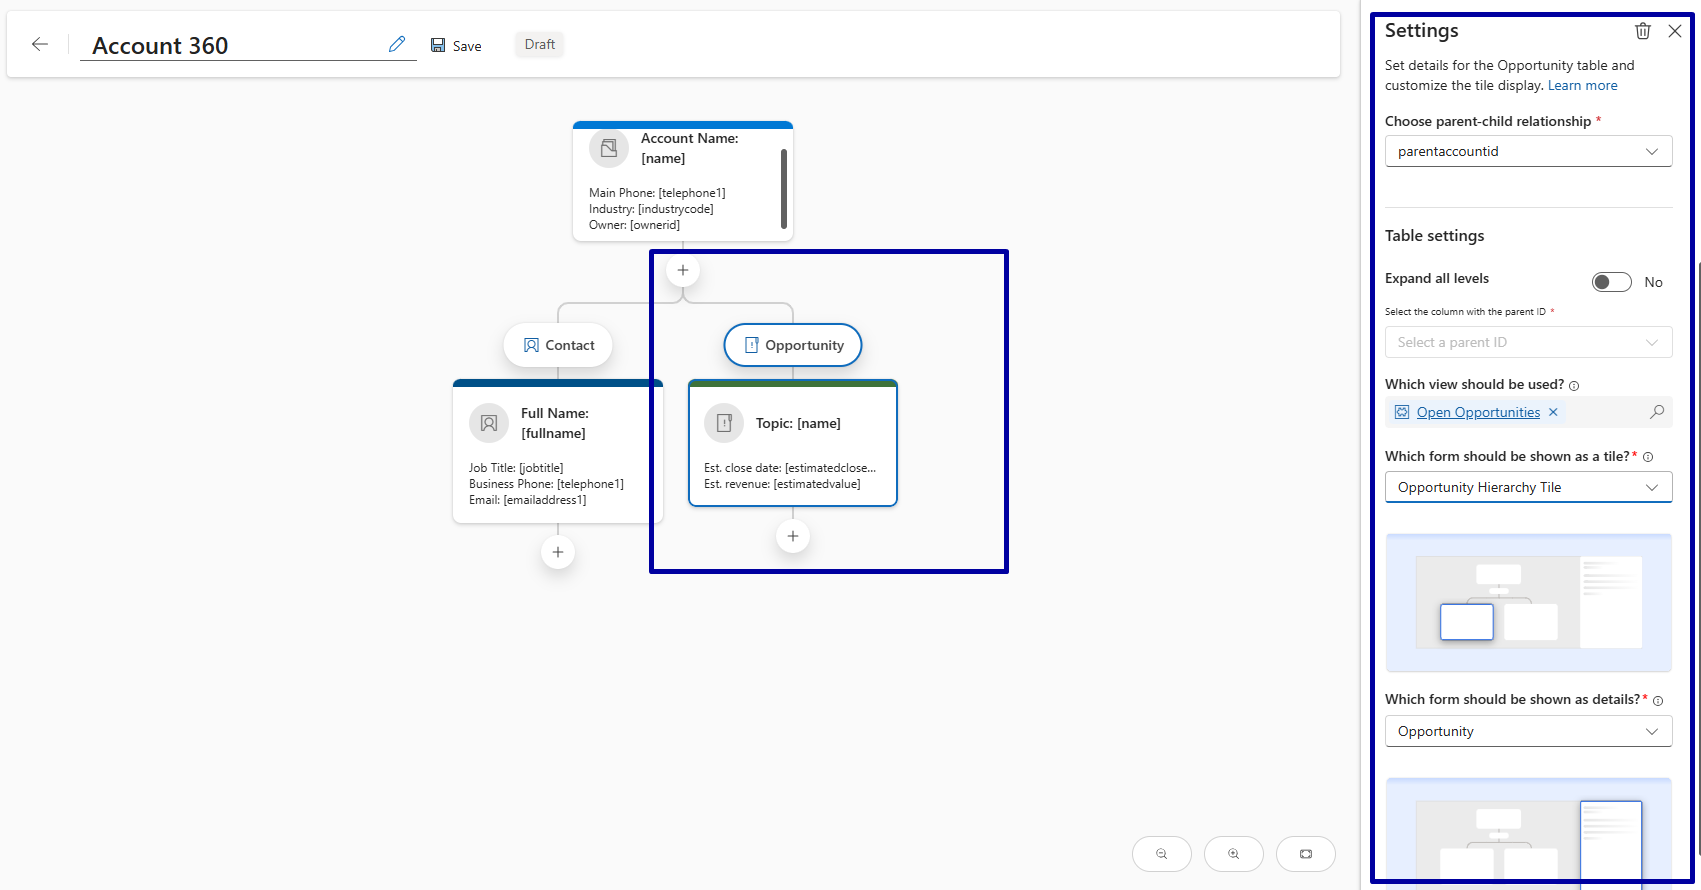
8. Add Opportunity under Account
Add Opportunity as a sibling branch, linked through the Potential Customer field, to show the account's deal history.
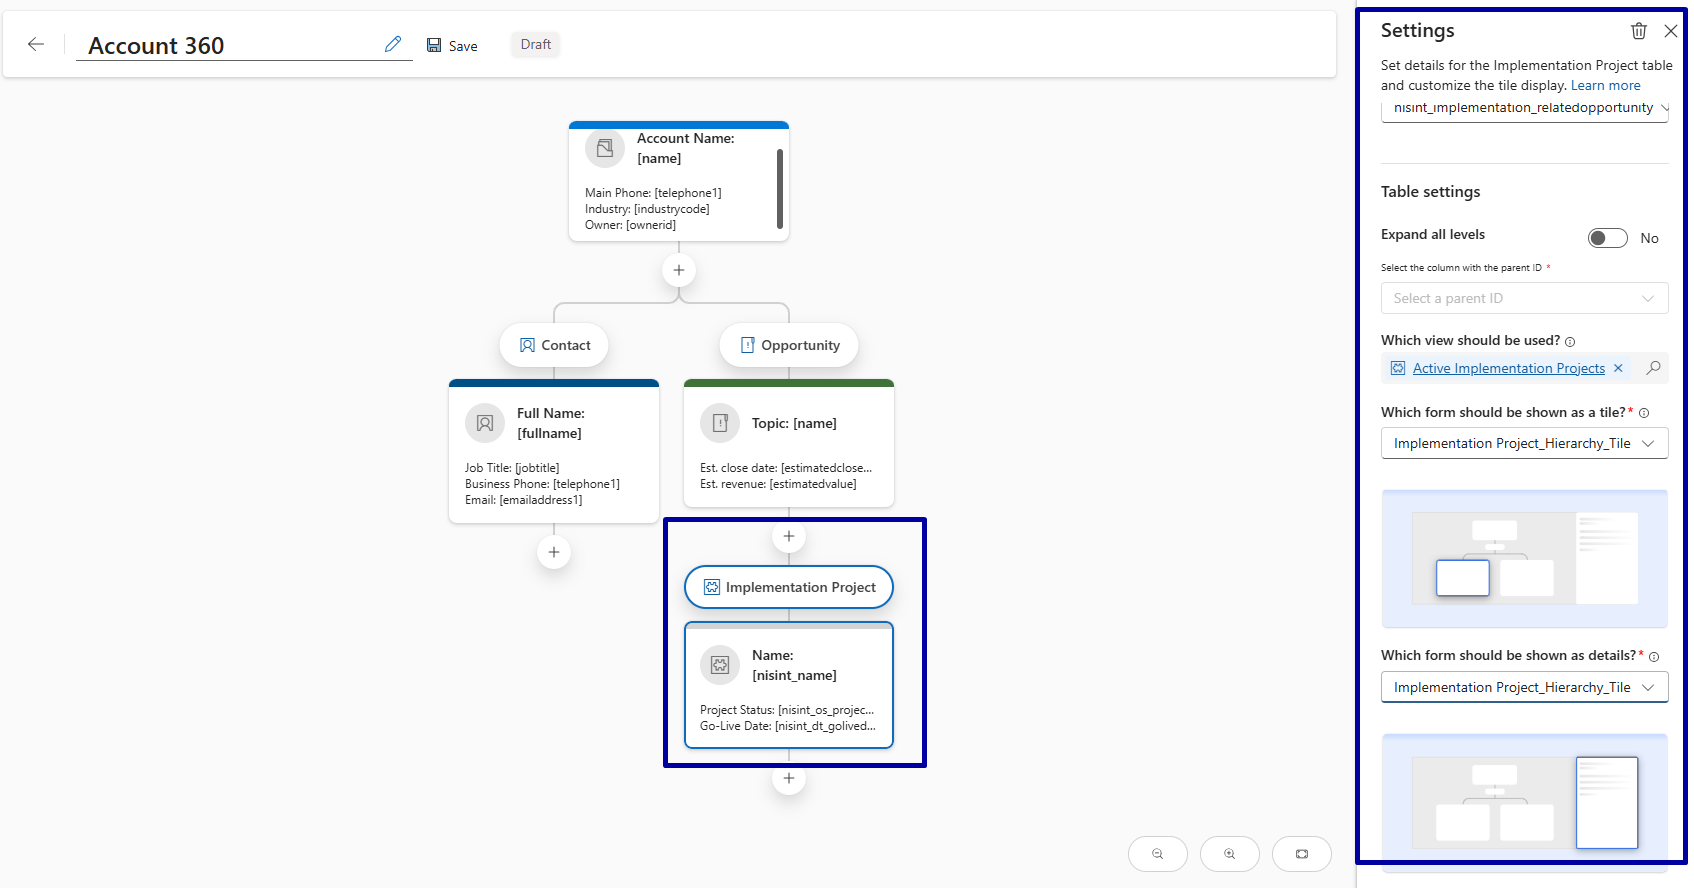
9. Nest Implementation Project under Opportunity
Add Implementation Project as a child of Opportunity, this is what turns a two-table view into a true four-level, multi-table hierarchy.
10. Preview and publish
Preview the hierarchy against a real account, confirm every branch loads correctly, then publish it for your users.
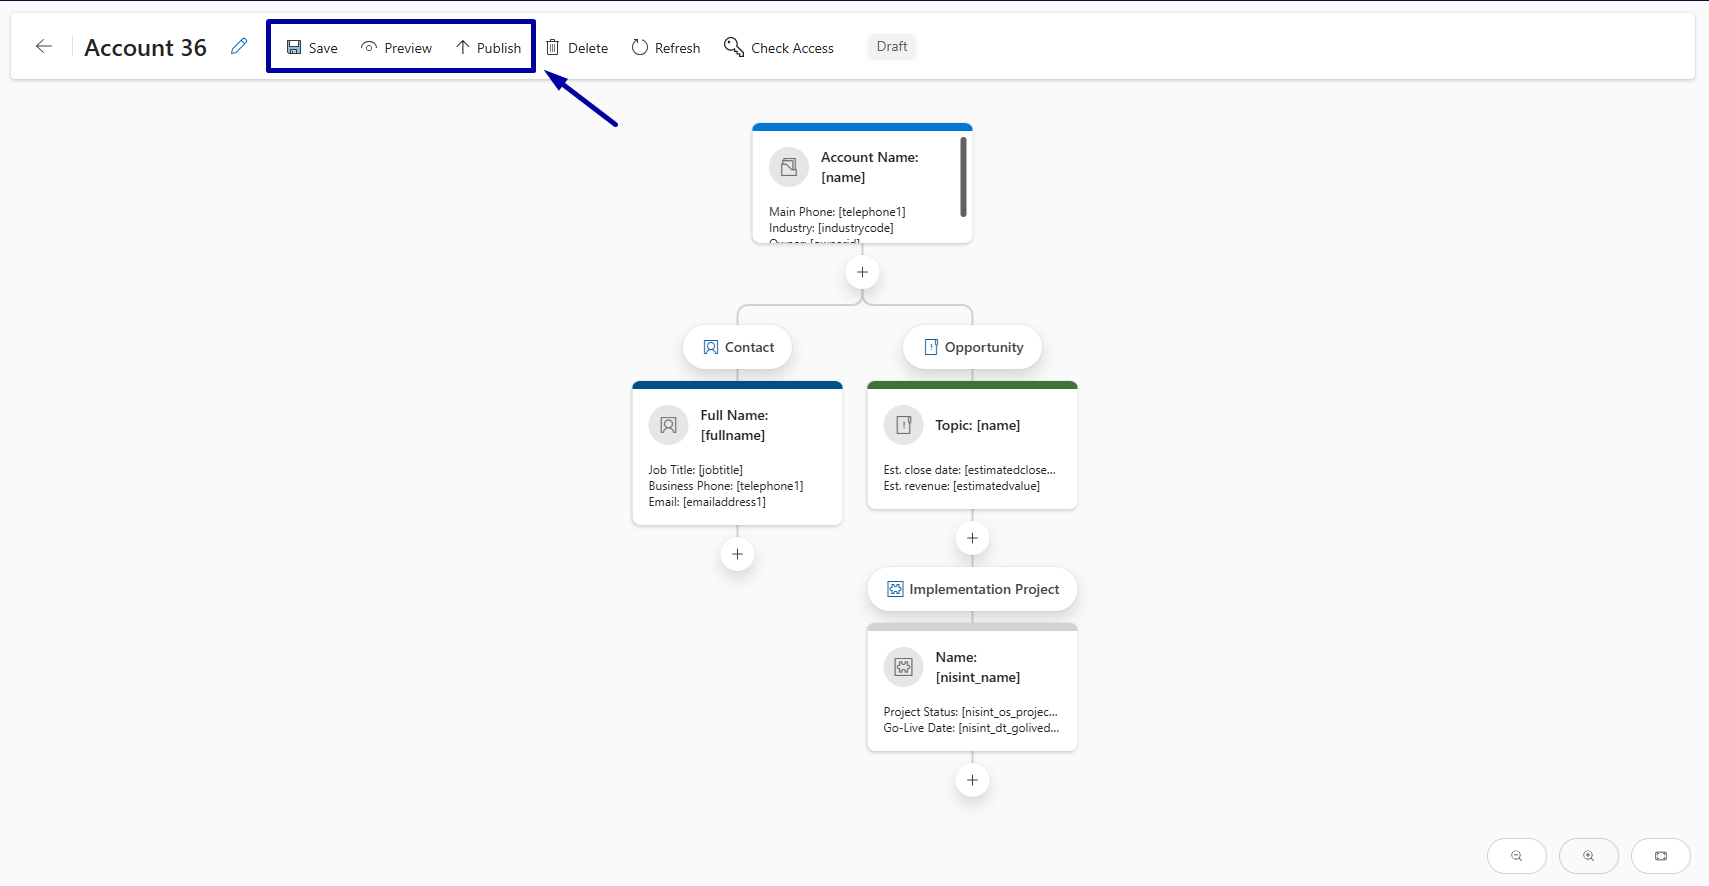
Open the hierarchy from a live Account record and confirm each branch loads with the right records - Contacts, Opportunities, and the Implementation Project correctly nested under the won opportunity, with tile data displaying as configured.
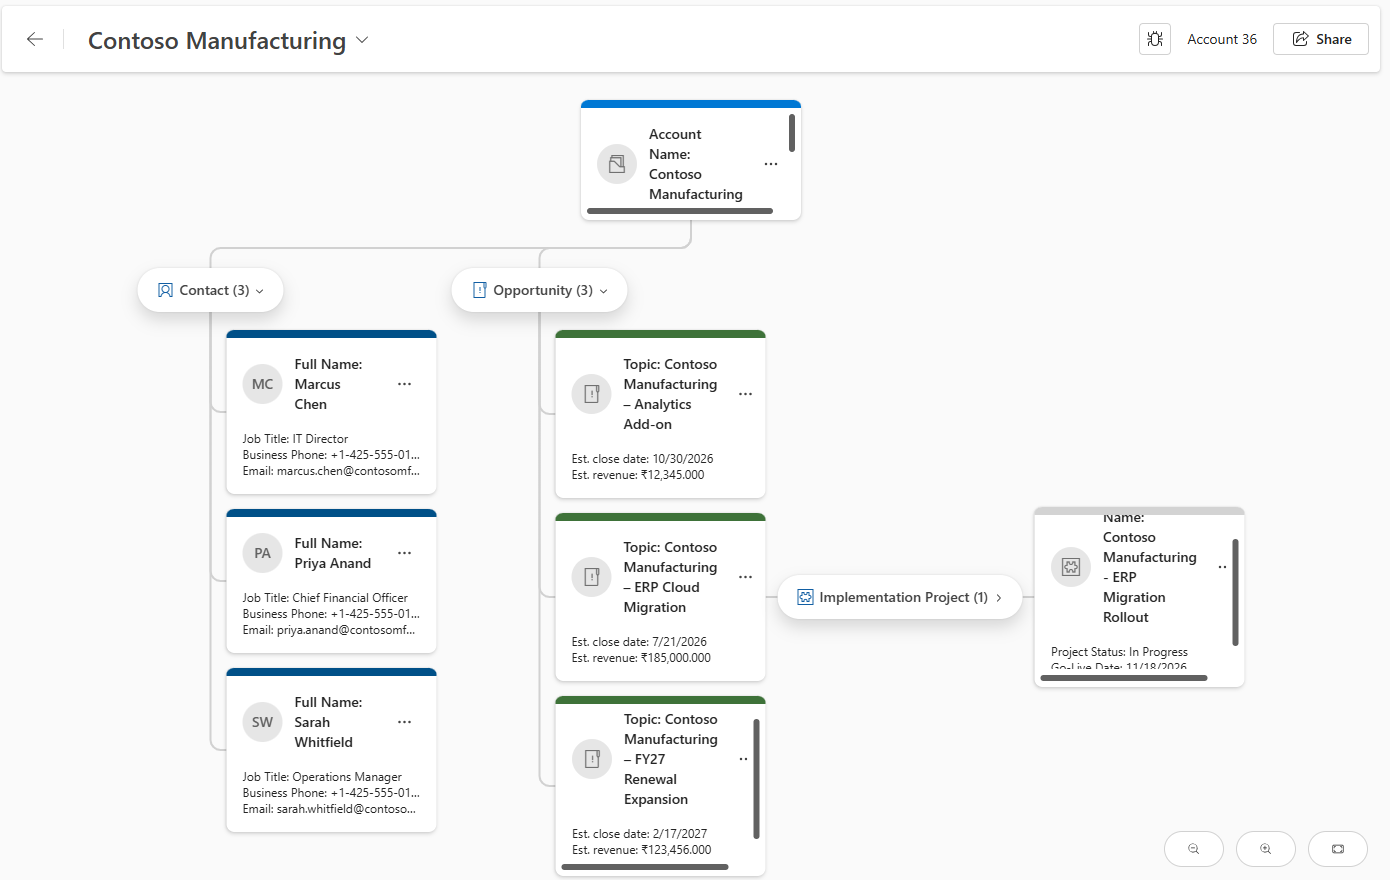
Multi-table hierarchies give sellers and account teams a single, interactive view of an account's people, deals, and delivery status - reducing manual navigation, surfacing risk signals faster, and extending naturally to any custom business process.
The Hierarchical Relationship Visualizer removes the old single-table limitation, letting you connect standard and custom tables into one navigable structure. As shown here with Account → Contact → Opportunity → Implementation Project, this capability turns scattered related records into one clear, actionable view - a pattern you can reuse for almost any multi-table business process.
Comment
Most Power BI reports in a Dynamics 365 environment live somewhere the user has to go and find: a dashboard,…
READ MORE
Introduction Many times, we come across scenarios where we need to populate a Word template in Dynamics 365 using Power…
READ MORE
Overview Email Templates in Microsoft Dataverse make it easy to reuse email content such as subject lines, message bodies, and…
READ MORE