
15 Sep, 2026
Posted on 15 Sep, 2026 by Vishal, Posted in Power BI Power Apps Dataverse Blog
 Blogs
Blogs
Most Power BI reports in a Dynamics 365 environment live somewhere the user has to go and find: a dashboard, a workspace, a link in a Teams channel. That's fine for management reporting, but it's the wrong shape for someone working a single record. An account manager looking at an account doesn't want the tenant-wide contact list — they want this account's contacts, right there on the form.
The good news is you don't need one report per customer. You build one report and embed it on the form with a filter that resolves against the record currently open. Every account gets its own scoped view of the same report, and the platform does the substitution for you — no JavaScript.
This post walks through exactly that, using a real example: showing an account's child contacts on the Account form, filtered on parentcustomerid.
Nothing works until the environment allows Power BI embedding. In the Power Platform admin center, go to Environments → your environment → Settings, expand Product, and open Features.
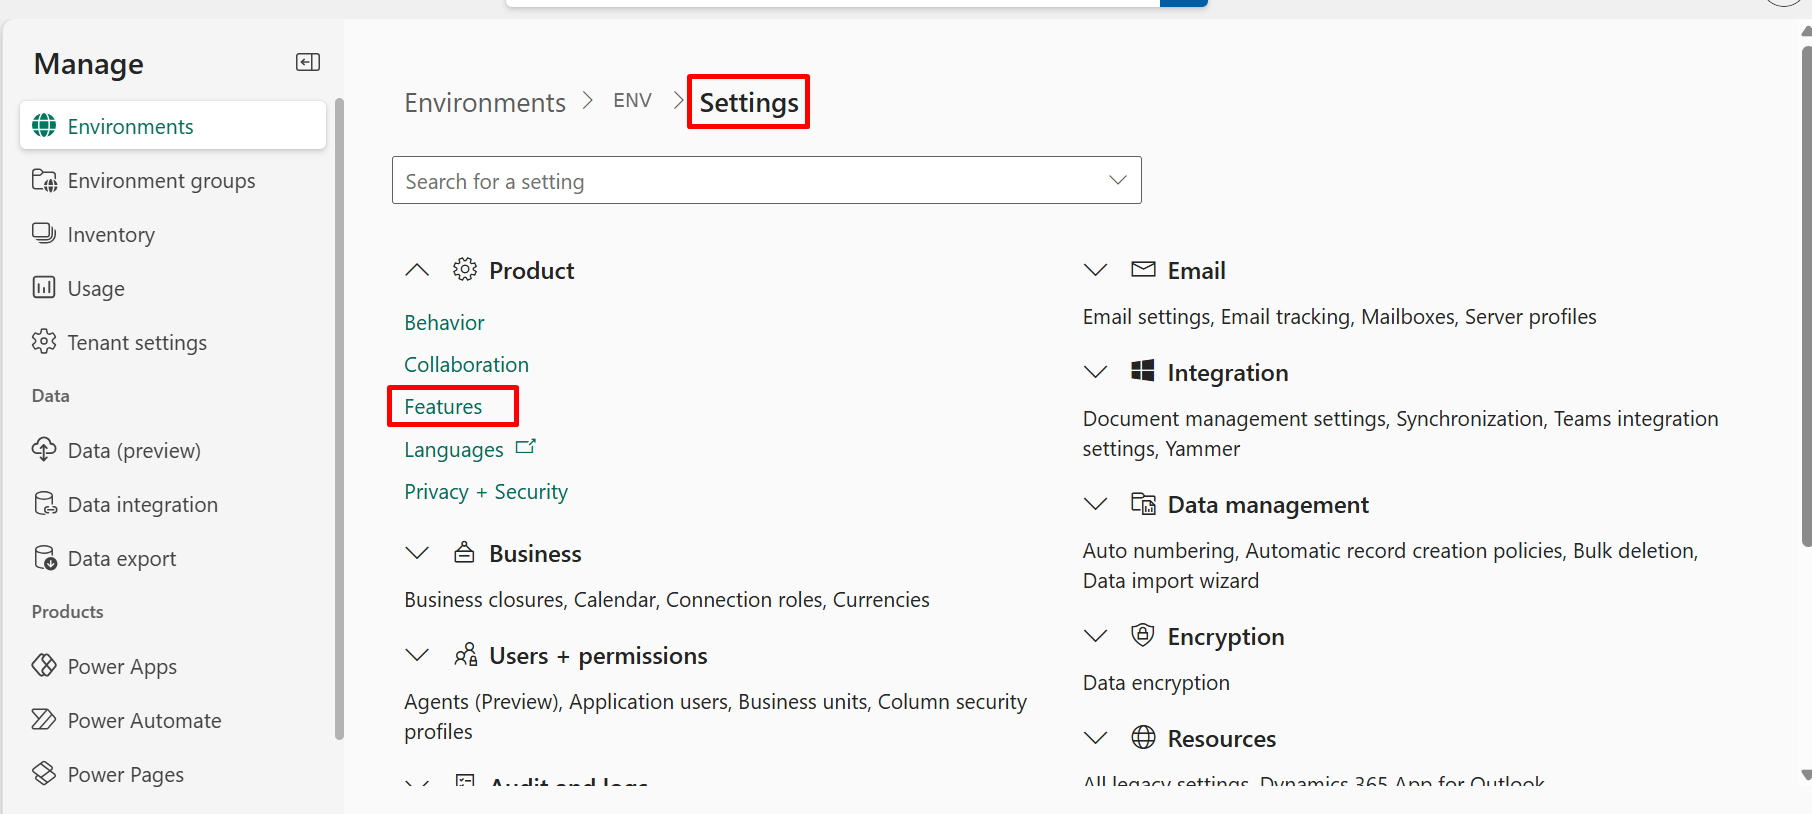
Inside Features, find the Embedded content group and turn on the Power BI visualization embedding setting. Save.
Do this per environment. It is not a tenant-level switch, so an embed that works in DEV renders nothing in UAT or PROD until you flip it there too. Worth putting on your deployment checklist alongside the solution import — it's a configuration setting, so it won't travel in your solution.
Open the report in Power BI or Fabric and look at the address bar. Every value you need for the FormXML is in there.
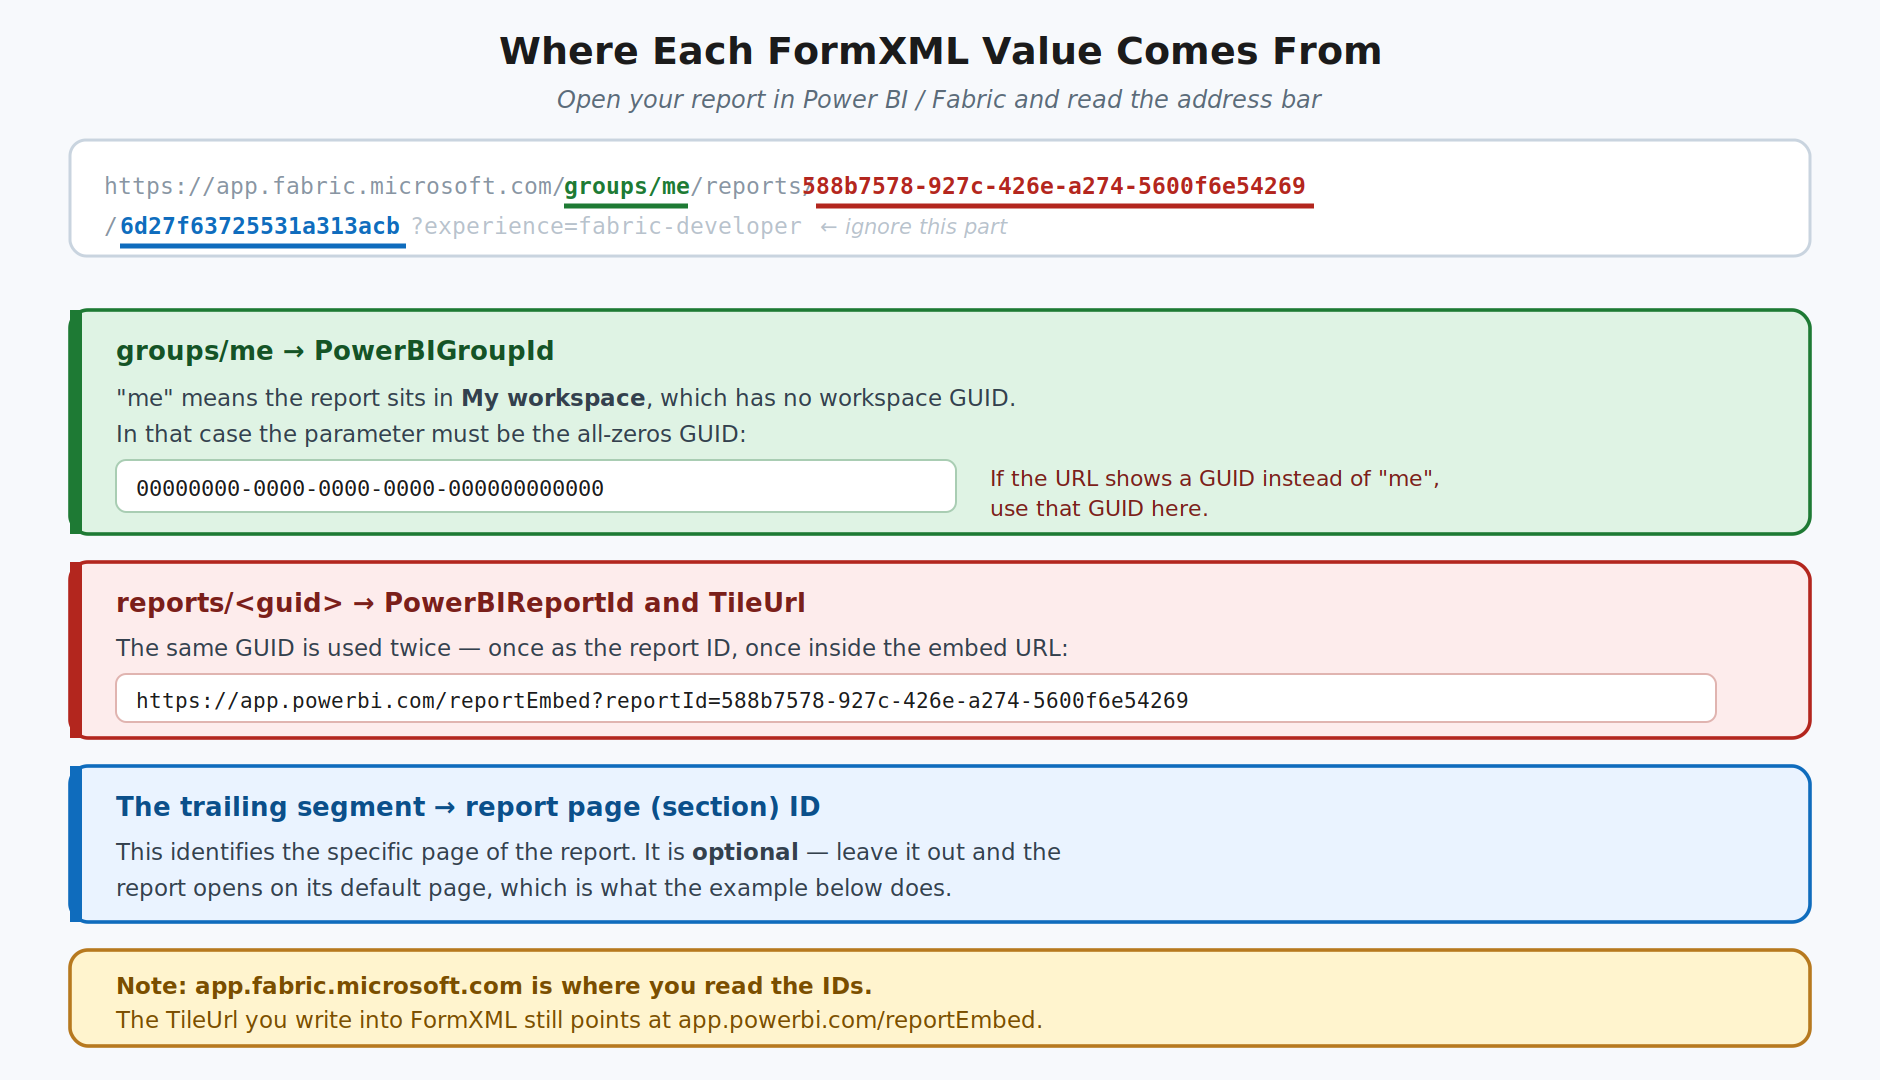
Using the example report URL:
https://app.fabric.microsoft.com/groups/me/reports/588b7578-927c-426e-a274-5600f6e54269/6d27f63725531a313acb?experience=fabric-developer
| URL segment | Goes into |
|---|---|
groups/me |
PowerBIGroupId — see the note below |
reports/588b7578-...-5600f6e54269 |
PowerBIReportId, and the reportId inside TileUrl |
6d27f63725531a313acb |
The report page ID — optional, omit for the default page |
?experience=fabric-developer |
Nothing. Ignore it. |
The groups/me detail is worth pausing on. me means the report lives in My workspace, which has no workspace GUID. In that case PowerBIGroupId must be the all-zeros GUID:
00000000-0000-0000-0000-000000000000
If your URL shows a real GUID after /groups/ instead of me, use that GUID.
That said, a report in My workspace isn't a good place to leave this. My workspace belongs to you personally — colleagues can't be granted access to it, and it goes with your account if you move on. It's fine for proving the concept in DEV, which is exactly what the all-zeros GUID is doing here. Before this reaches real users, move the report into a shared workspace and swap in that workspace's GUID.
In the modern form designer, open your table's main form (Account, here) and add a new tab with a section inside it. Give the tab a meaningful label — in this example, Contact (PowerBI Report).
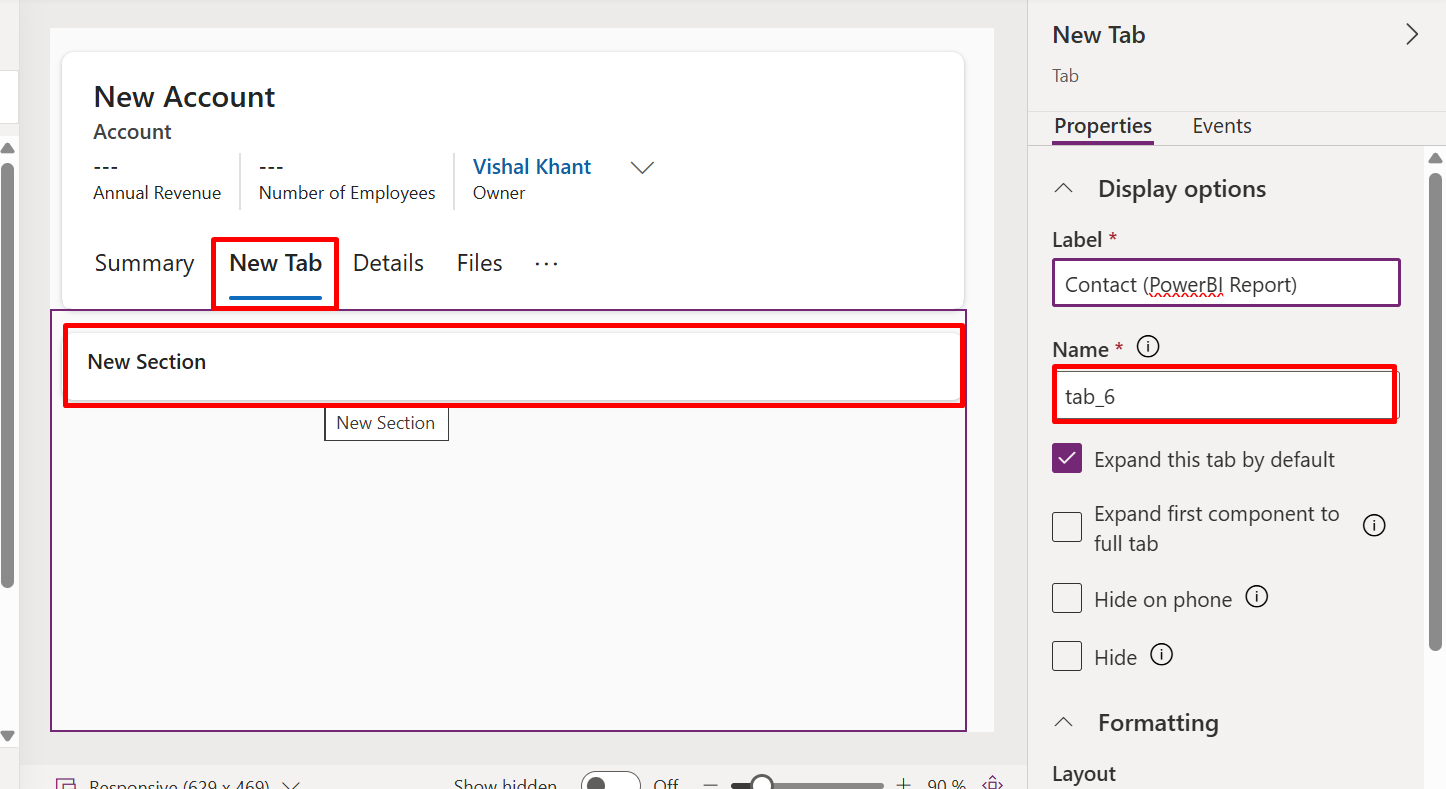
Note the tab's Name, not just its label. Here it's tab_6, which makes the section inside it tab_6_section_1. You'll use those names in a moment to find the right place in the FormXML — on a form with a dozen tabs, that's the difference between a five-second search and a lot of scrolling.
Save and publish before moving on, so the tab and section actually exist in the form XML.
Placement is deliberate: putting the report on its own tab means it only loads when a user clicks that tab, keeping it off the critical path for everyone who opened the record for some other reason.
The Power BI report control can't be added through the form designer — it has to be written into the form XML directly. Open XrmToolBox → FormXML Editor, load your table, and open the form.
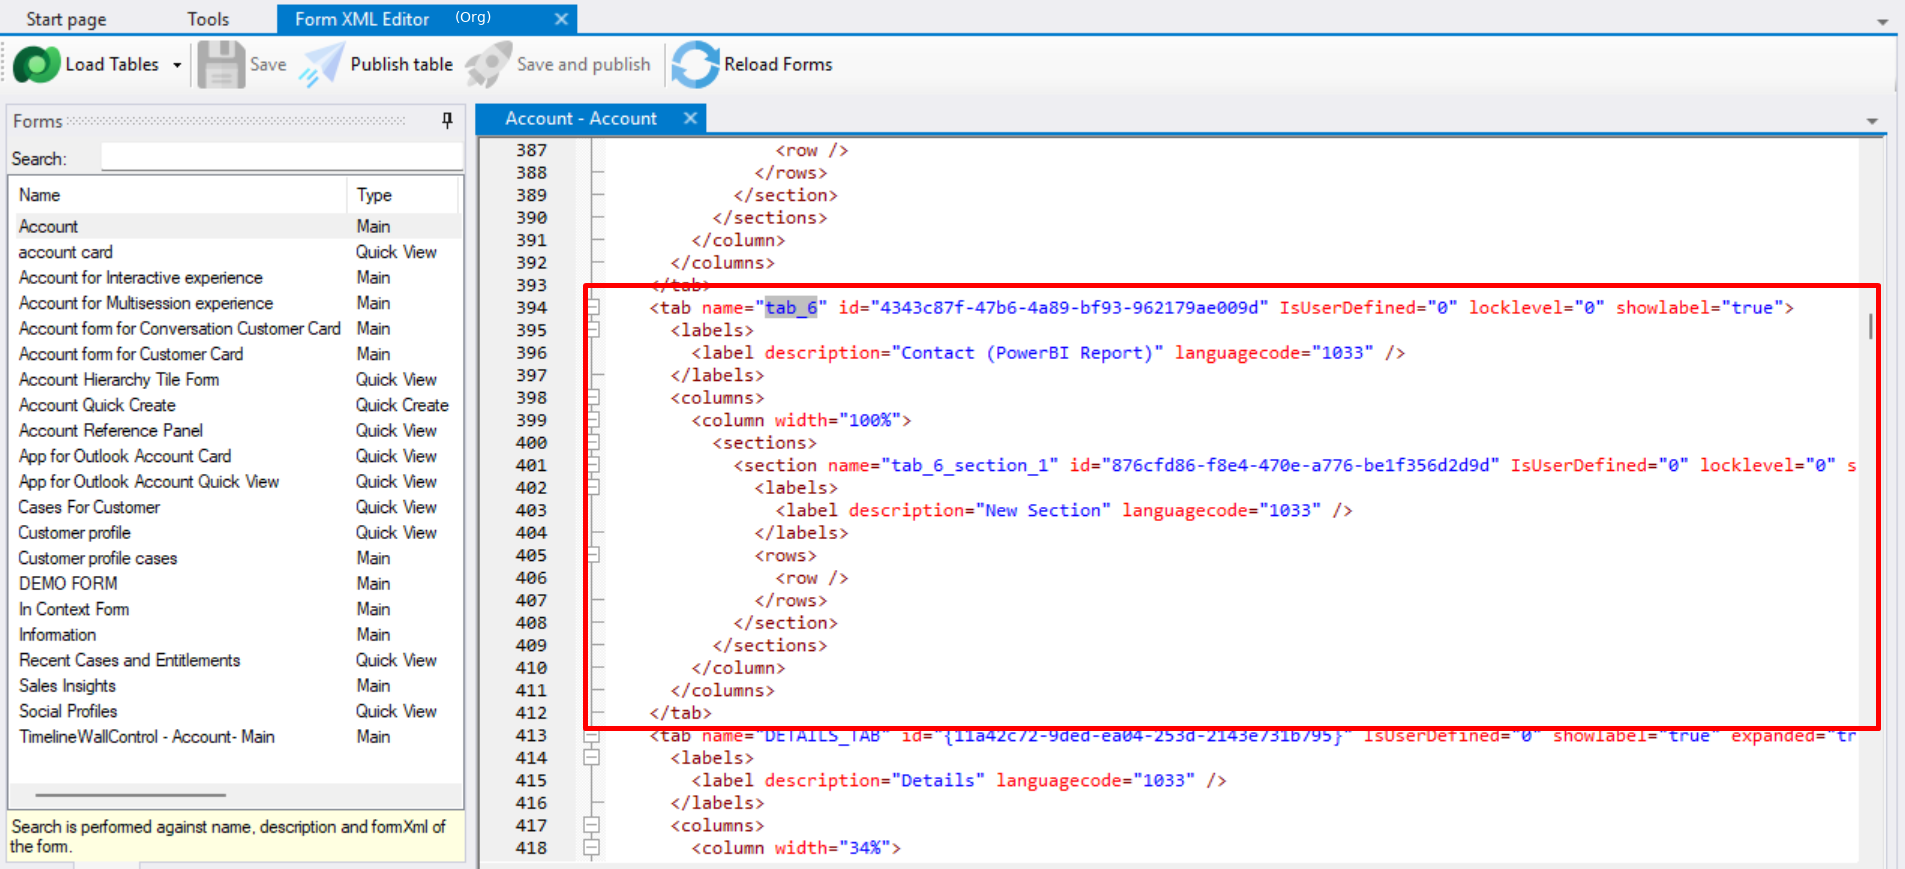
Search for the tab name from Step 3 (tab_6) and find its section. You want the rows element inside the section named tab_6_section_1 — that's where the control goes.
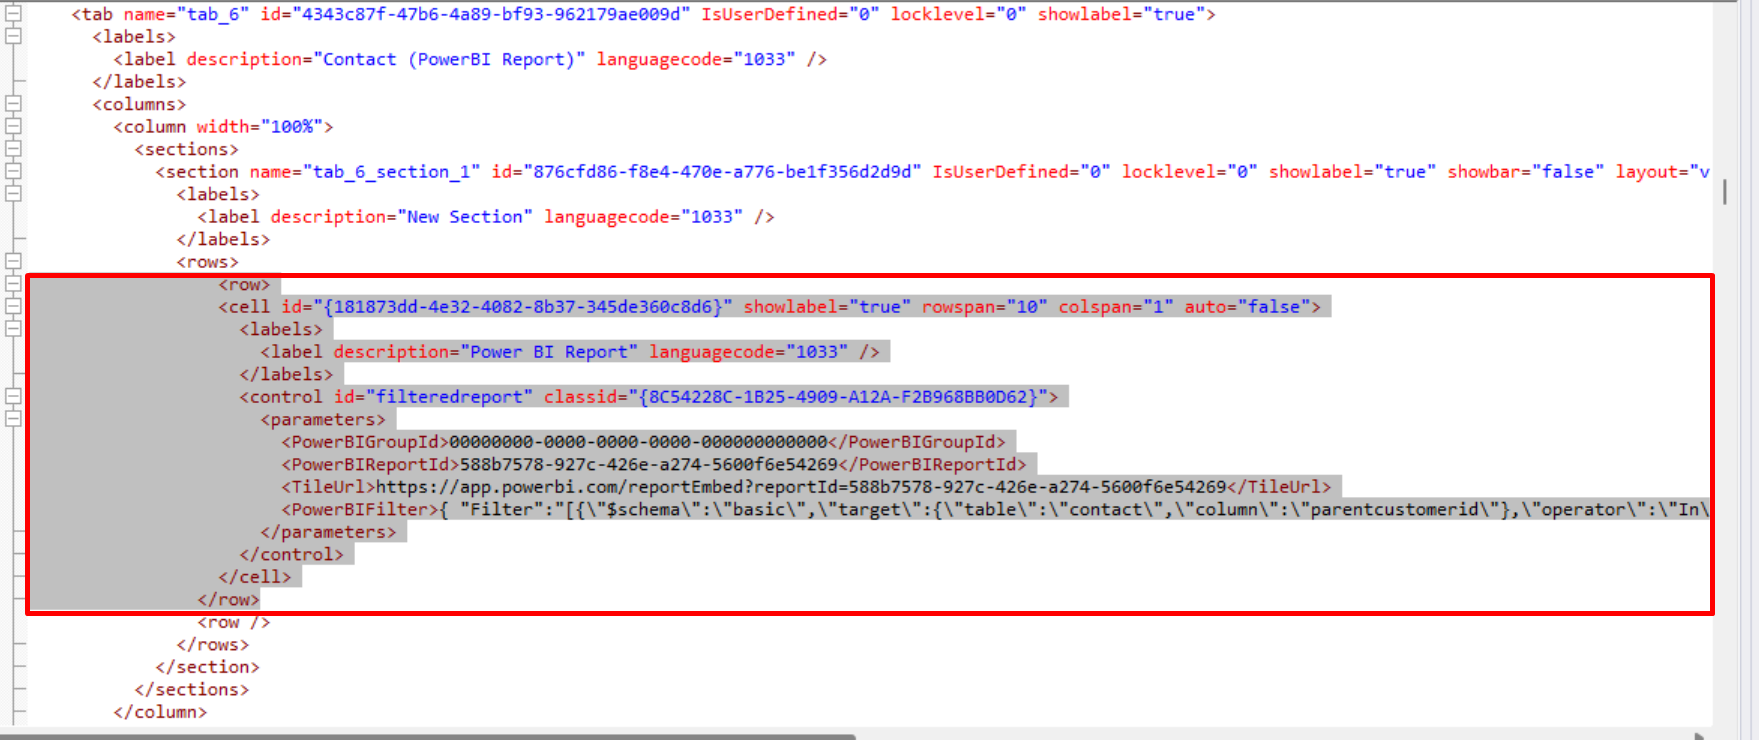
Paste the following as a row
|
<row>
  <cell id="{181873dd-4e32-4082-8b37-345de360c8d6}" showlabel="true" rowspan="10" colspan="1" auto="false">
    <labels>
      <label description="Power BI Report" languagecode="1033" />
    </labels>
    <control id="filteredreport" classid="{8C54228C-1B25-4909-A12A-F2B968BB0D62}">
      <parameters>
        <PowerBIGroupId>00000000-0000-0000-0000-000000000000</PowerBIGroupId>
        <PowerBIReportId>588b7578-927c-426e-a274-5600f6e54269</PowerBIReportId>
        <TileUrl>https://app.powerbi.com/reportEmbed?reportId=588b7578-927c-426e-a274-5600f6e54269</TileUrl>
        <PowerBIFilter>{ "Filter":"[{\"$schema\":\"basic\",\"target\":{\"table\":\"contact\",\"column\":\"parentcustomerid\"},\"operator\":\"In\",\"values\":[\"$a\"],\"filterType\":1}]", "Alias":{"$a":"accountid"}}</PowerBIFilter>
      </parameters>
    </control>
  </cell>
</row>
| Value | Change it? | Notes |
|---|---|---|
cell id |
Yes | Must be a new, unique GUID. Generate a fresh one — don't reuse the one above. A duplicate cell ID fails validation or behaves oddly. |
classid |
No | {8C54228C-1B25-4909-A12A-F2B968BB0D62} is the Power BI report control. Same everywhere. |
control id |
Optional | Any name unique on the form. filteredreport is fine. |
PowerBIGroupId |
Yes | Your workspace GUID, or all-zeros for My workspace. |
PowerBIReportId |
Yes | Your report GUID from the URL. |
TileUrl |
Yes | Same report GUID again. Keep the app.powerbi.com/reportEmbed host. |
PowerBIFilter |
Yes | Your table, column, and alias attribute — see below. |
rowspan |
Maybe | 10 gives the report a reasonable height. Increase it if the report looks cramped. |
label description |
Optional | What shows above the control. |
One easy-to-miss detail: TileUrl must be clean, unescaped URL text. If you copy this snippet out of a blog post or chat message, markdown link syntax sometimes comes along for the ride and you end up with stray [ and ](...) characters wrapped around the URL. That produces a control that silently fails to render. Paste into a plain text editor first and eyeball it.
The PowerBIFilter parameter is where the real work happens, and it's worth understanding rather than copying blind.
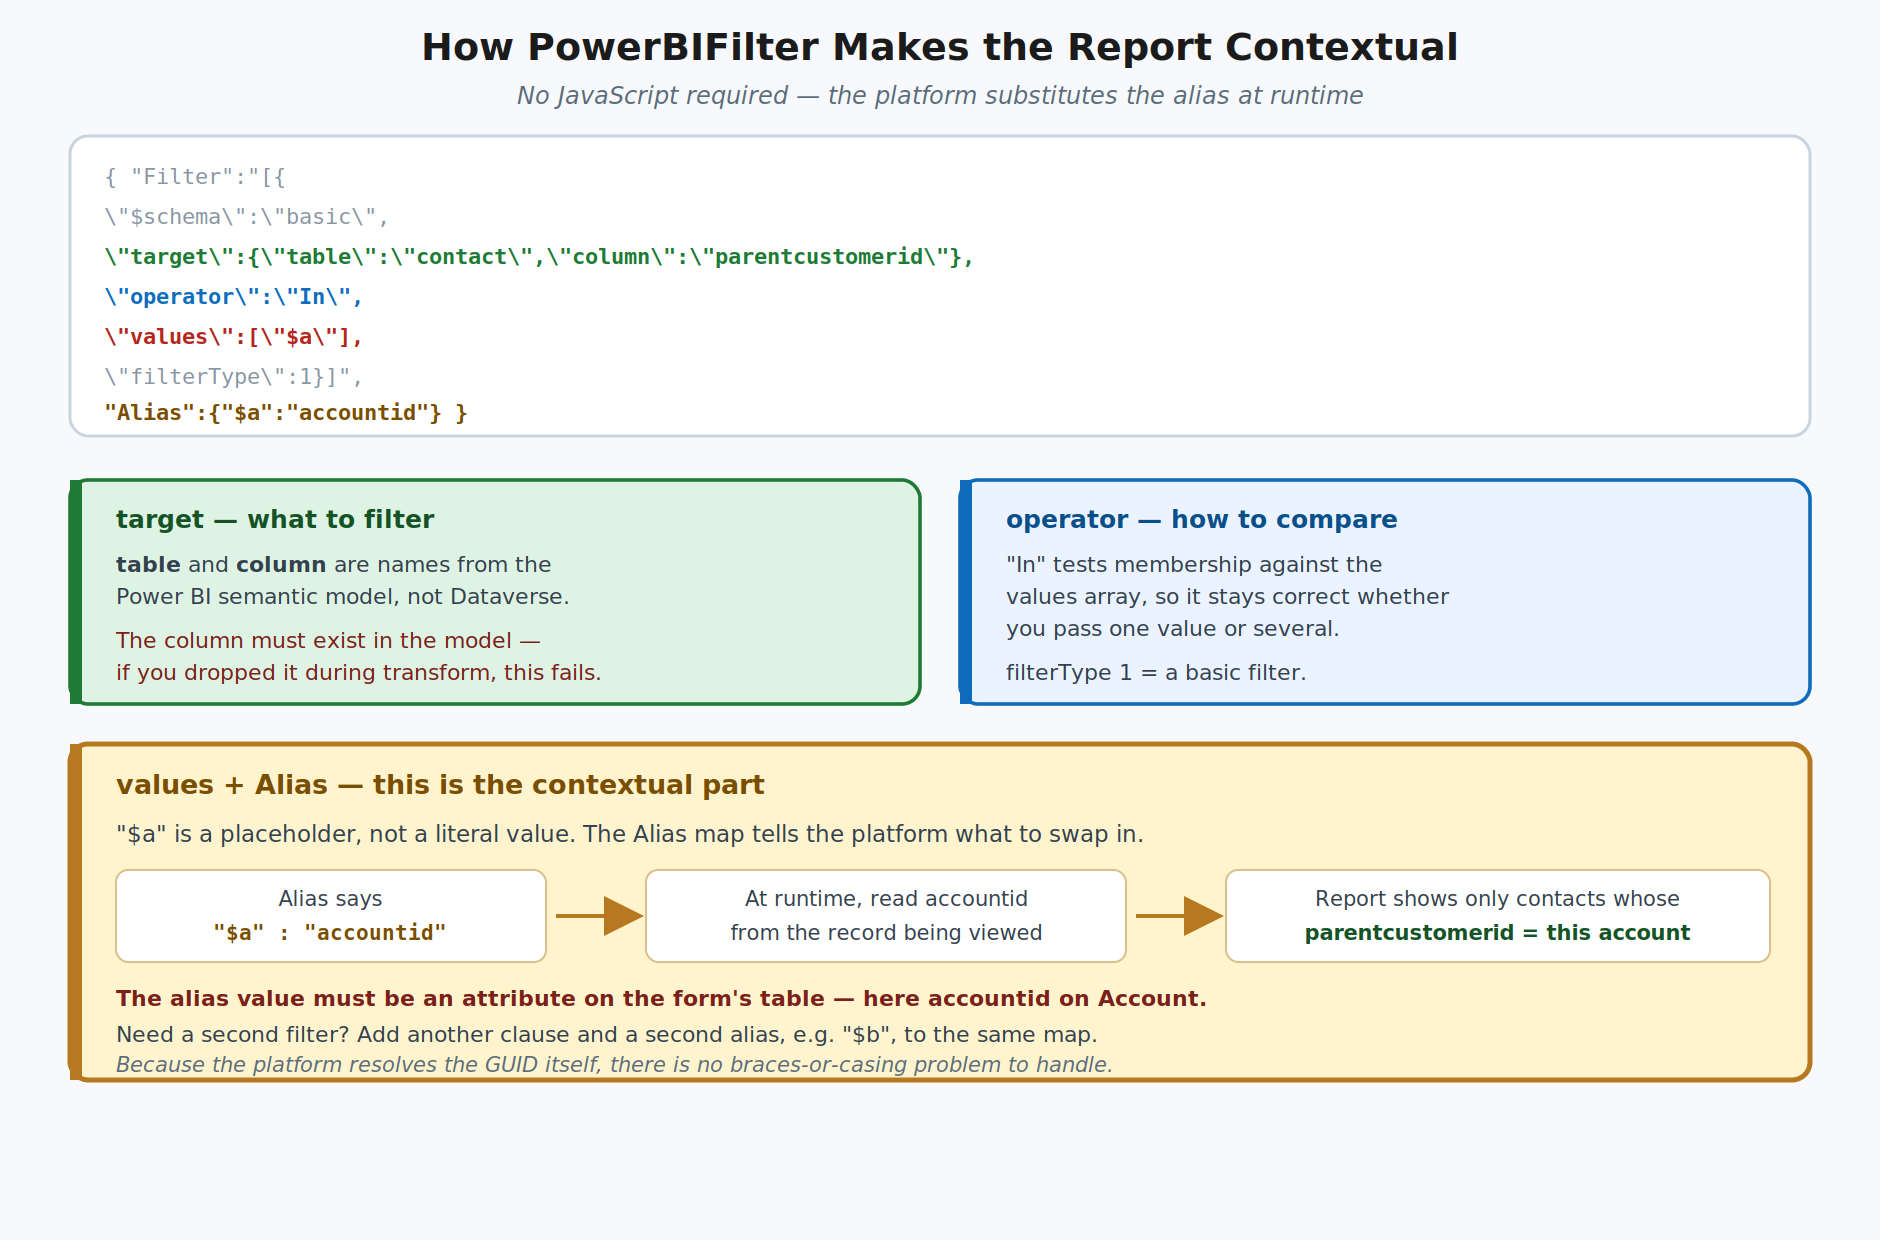
Reformatted for readability, the filter is:
{
  "Filter": "[{
      \"$schema\":\"basic\",
      \"target\":{\"table\":\"contact\",\"column\":\"parentcustomerid\"},
      \"operator\":\"In\",
      \"values\":[\"$a\"],
      \"filterType\":1
  }]",
  "Alias": { "$a": "accountid" }
}
Breaking that down:
target — the table and column to filter on. These are names in the Power BI semantic model, not Dataverse logical names. If you renamed things during transformation, use the Power BI names. And the column has to actually be present in the model: if parentcustomerid was dropped to tidy up the dataset, there is nothing to filter on and no amount of XML will fix it.operator: "In" — tests membership against the values array, so the same expression works whether you pass one value or several.values: ["$a"] — $a is a placeholder, not a value. This is the key idea.Alias: {"$a": "accountid"} — tells the platform to replace $a at runtime with the accountid of the record currently open.So when a user opens an account, the platform reads that record's accountid, substitutes it for $a, and the report renders showing only contacts whose parentcustomerid matches. Open a different account, get a different set. One report, filtered per record.
The alias value must be an attribute on the form's table — accountid on Account here. A nice side effect of the platform doing the substitution: you never deal with getId() returning a braced, uppercase GUID, which is the classic failure mode when people build these filters in JavaScript instead.
Need to filter on more than one thing? Add a second clause to the filter array and a second alias ($b, and so on) to the same map.
In the FormXML Editor, validate the XML, then Save and publish. Reload the form and click your new tab.
Here is the finished tab on an Account record. The report is embedded directly in the form, and every row it returns belongs to the account currently open:
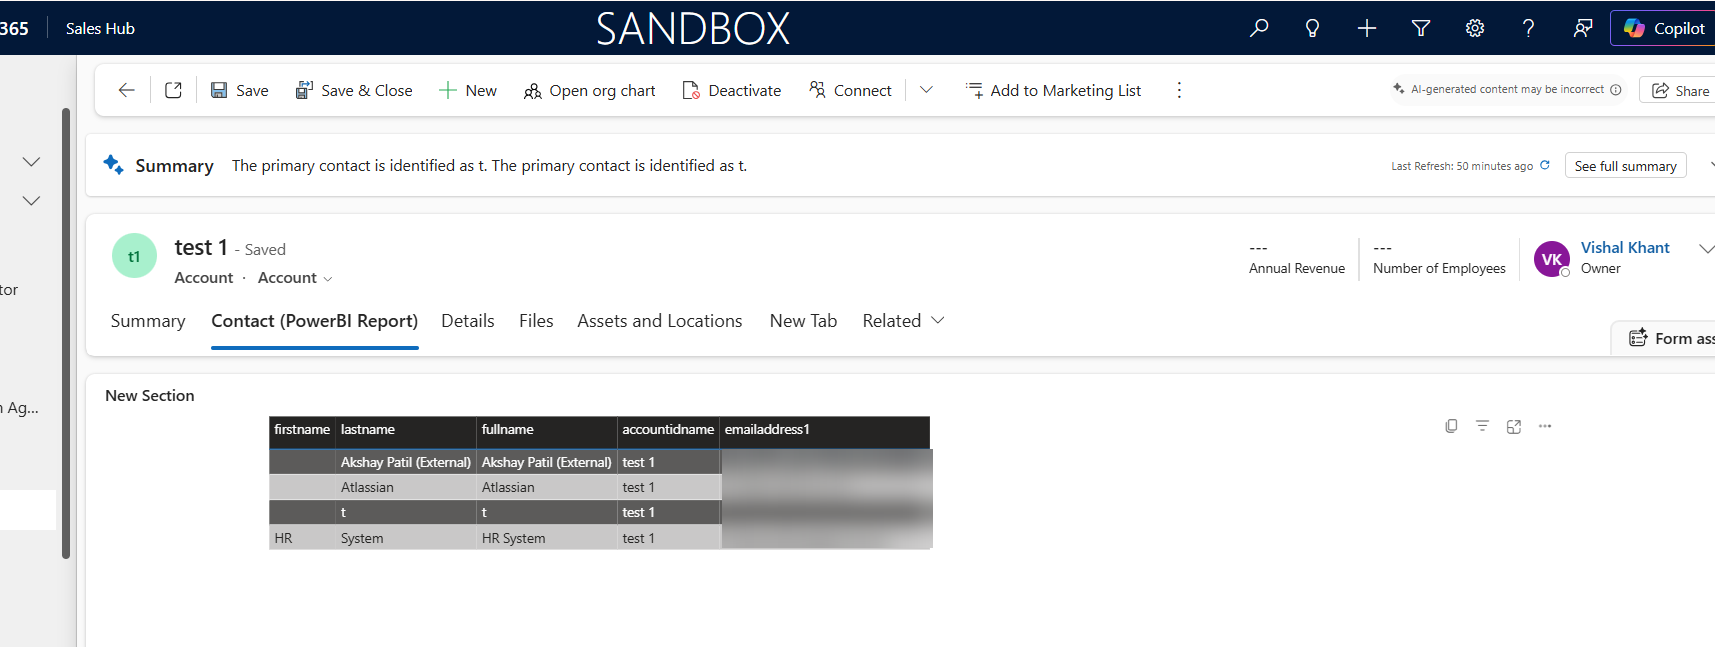
Look at the accountidname column — every row reads the same account name. That is the filter doing its job. Open a different account and the same report returns a different set of rows, with no change to the report itself.
For contrast, this is the identical report opened directly in Power BI with no filter applied:
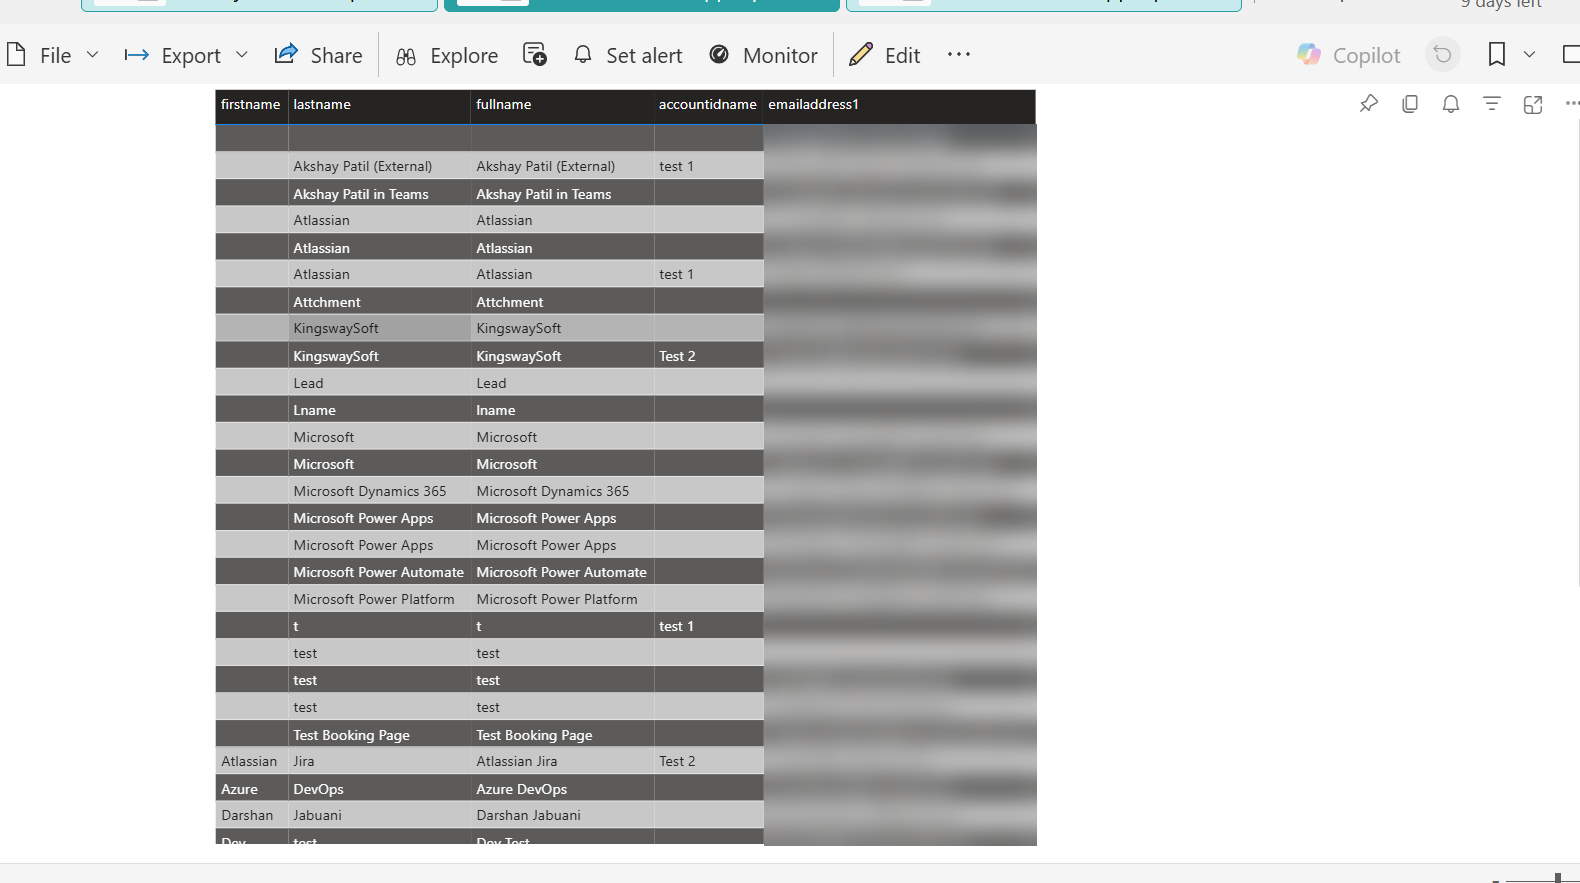
Same report, same semantic model. Here accountidname shows a mix of different accounts and blanks, because nothing is scoping it. The only difference between these two screenshots is the filter the form passes in — which is the whole idea: one report, filtered per record, instead of one report per customer.
If your report appears but shows everything, the filter isn't being applied — see troubleshooting below.
The two screenshots in the previous section make this concrete, so it's worth being blunt.
The record filter is a convenience feature, not a security boundary. The unfiltered screenshot is what the underlying report actually contains: every contact in the environment. The form filter narrows what gets displayed; it does not remove the rest of the data from the report.
What follows from that:
Use the record filter for convenience and RLS for security. Don't let the filtered-looking form lull you into thinking the data is scoped — it isn't.
Users on a record form assume what they see is current. Depending on your model, it may not be:
Pick deliberately and tell your users. On import mode, a visible last-refresh timestamp on the report page saves a surprising number of support tickets.
| Symptom | Likely cause |
|---|---|
| Control renders nothing at all | Embedded content not enabled on this environment; or a malformed TileUrl (check for stray markdown characters) |
| Blank control or access error for some users | Those users lack Power BI report/workspace access, or lack a Pro licence with a non-Premium workspace |
| Report loads but shows all records | PowerBIFilter malformed, or the alias attribute isn't on the form's table |
| Visible filter error | table or column doesn't match the Power BI model names, or the column isn't in the model |
| Works in DEV, not elsewhere | Environment feature not enabled there; or report sits in My workspace, which nobody else can reach |
| Works for you, not colleagues | You're testing as an admin — verify as an affected user |
| FormXML won't validate | Duplicate cell id — regenerate a unique GUID |
| Data looks stale | Refresh schedule on an import-mode semantic model |
The mechanism is small once it clicks: one report, one control in the FormXML, and an alias that resolves to the open record's ID. Most of the effort is in the surrounding details — enabling the feature per environment, confirming the filter column survived into the semantic model, generating a unique cell ID, and being honest about whether you need RLS.
Get those right and users get something they notice immediately: analytics where the work is happening, scoped to the thing they're already looking at.
Comment
Introduction Most teams building Power Automate flows eventually land on the same pattern: wrap your business logic in a Scope,…
READ MORE
Introduction Custom Pages provide a modern way to edit records in Dynamics 365. A common approach is to open a…
READ MORE
How to Dynamically Switch Business Process Flow When Changing Forms in Dynamics 365 Introduction Microsoft Dynamics 365 provides powerful customization…
READ MORE