
31 Mar, 2026
Posted on 31 Mar, 2026 by Trupti Nikumbh, Posted in Microsoft Power Platform PowerApps Portal Power Platform
 Blogs
Blogs
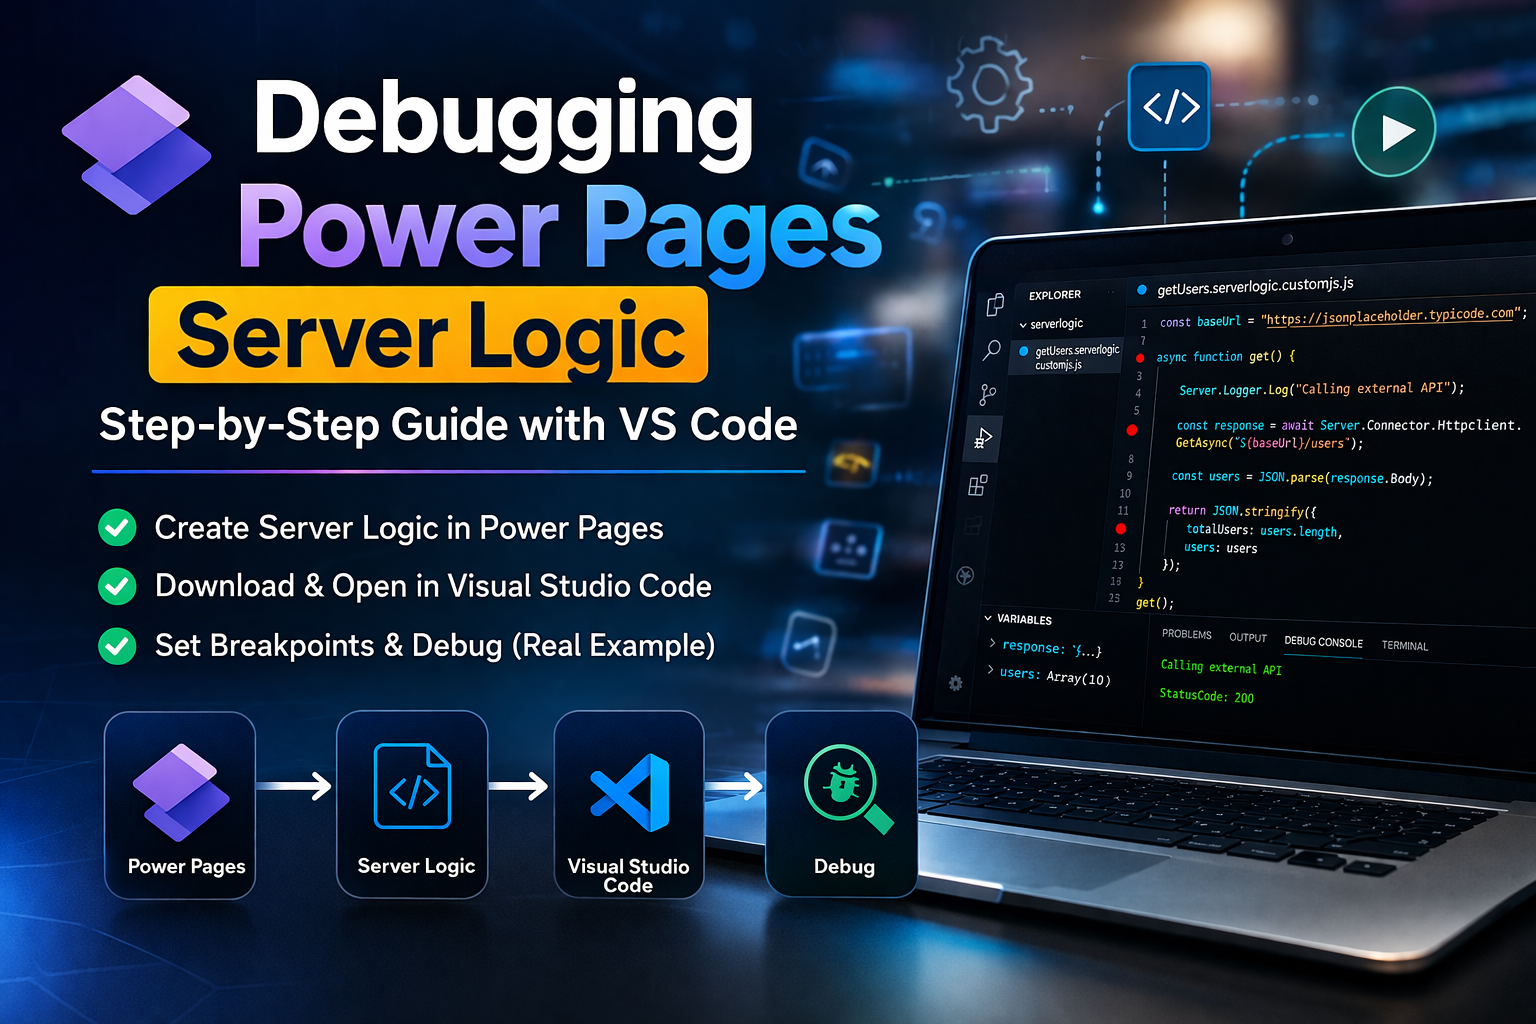
Power Pages Server Logic allows developers to execute secure backend JavaScript directly within Power Pages. It is commonly used for tasks like calling external APIs, validating business rules, or performing secure data processing.
Microsoft recently introduced the ability to debug server logic locally using Visual Studio Code, which makes development faster and easier.
In this blog, we will walk through a complete step-by-step process to:
Create Server Logic in Power Pages
Download the portal code
Open the project in Visual Studio Code
Add breakpoints
Debug the server logic
In this example, our Server Logic will call an external API and retrieve user data.
We will use a public API:
https://jsonplaceholder.typicode.com/users
This API returns sample user data, which makes it ideal for debugging demonstrations.
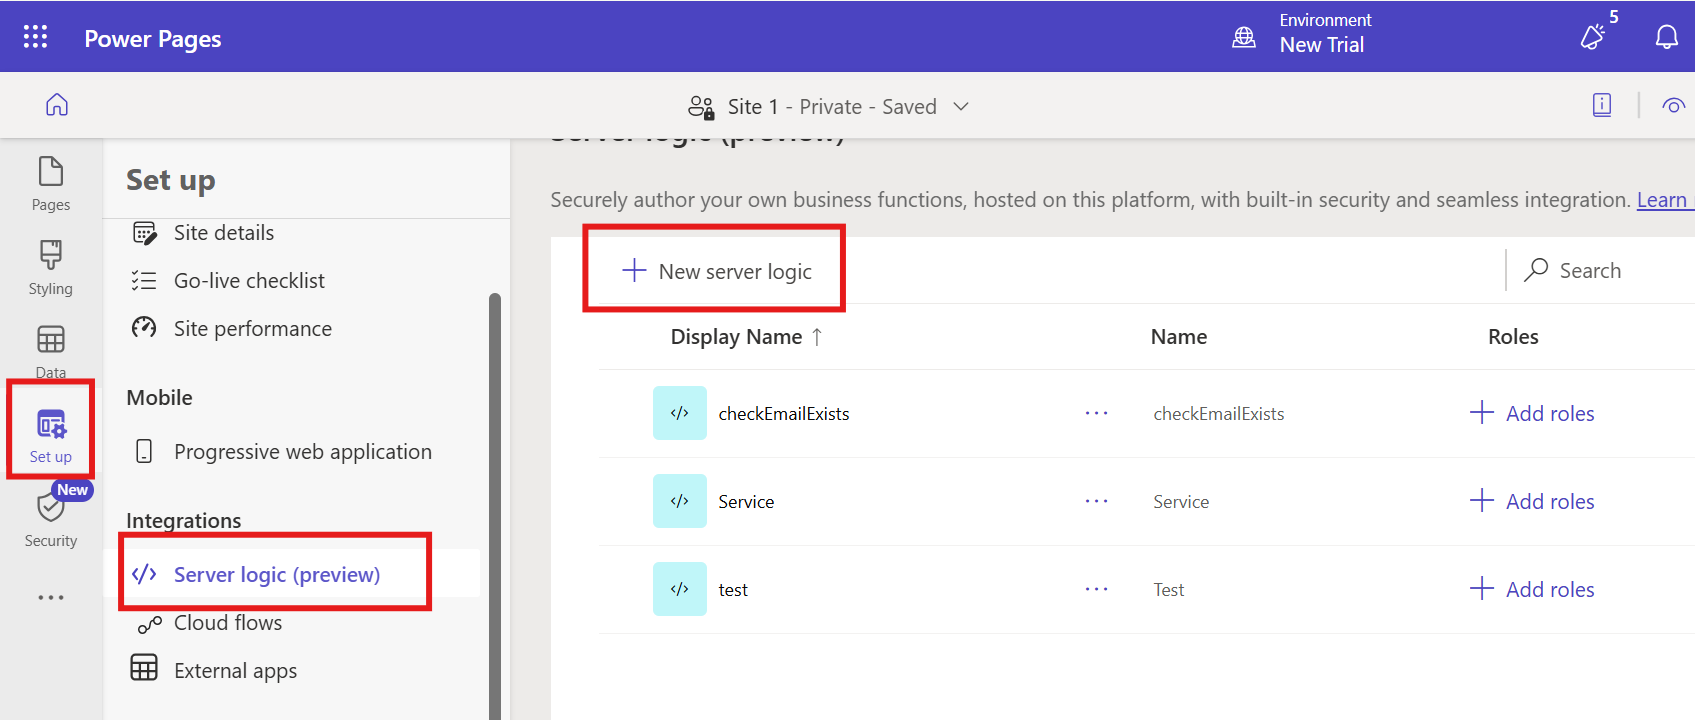
First, create the server logic inside your Power Pages site.
Open Power Pages Studio
Navigate to Set up workspace
Click Server Logic
Click + New Server Logic
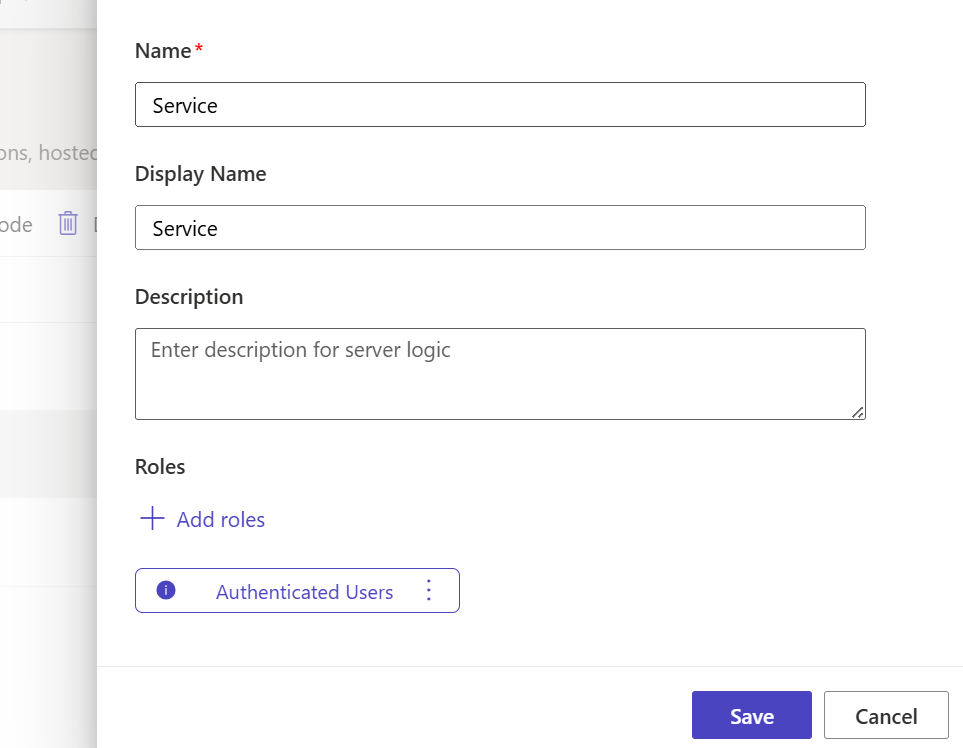
Provide the following details:
| Field | Value |
|---|---|
| Name | Service |
| Display Name | Service (optional) |
| Web Role | Authenticated Users |
Save the server logic.
Note: Add Web Role as per your requirement
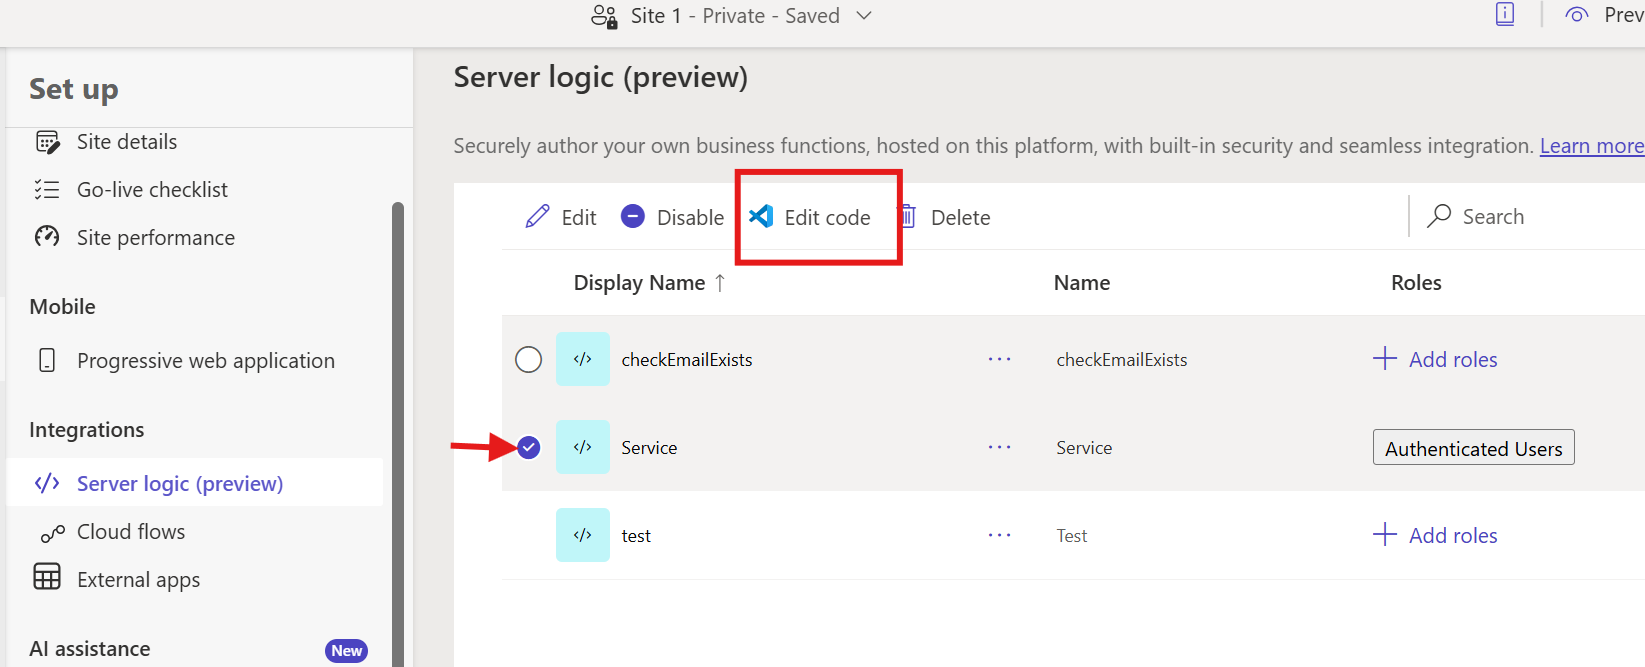
Click Edit Code and add the following code.
const baseUrl = "https://jsonplaceholder.typicode.com";

async function get() {

try {

Server.Logger.Log("Calling external API");

const response = await Server.Connector.HttpClient.GetAsync(
`${baseUrl}/users`,
{"Accept":"application/json"}
);

const users = JSON.parse(response.Body);

return JSON.stringify({
totalUsers: users.length,
users: users
});

} catch (err) {

Server.Logger.Error(err.message);

return JSON.stringify({
error: err.message
});

}

}
This server logic:
Calls an external API
Retrieves user data
Returns the data as JSON
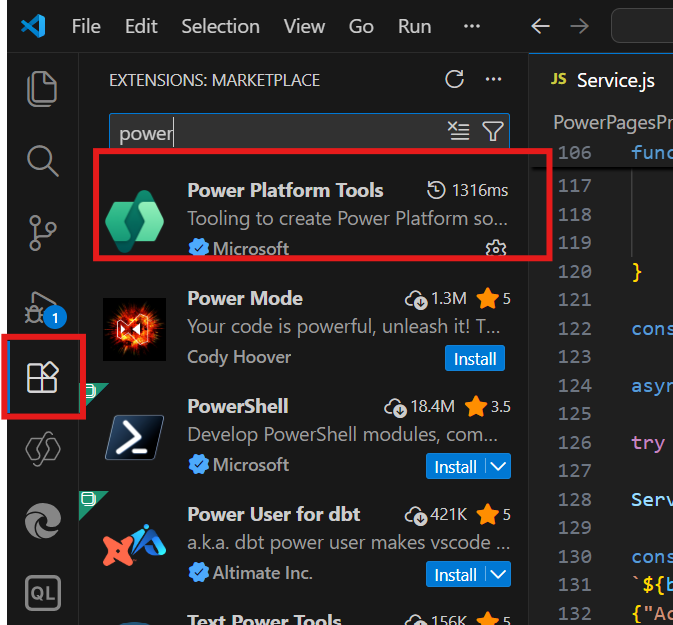
Install Power Platform Tools Extension
Open VS Code → Extensions and install:
Power Platform Tools
Open the terminal and run:
pac auth create
Sign in with your Power Platform account.
Create a folder where the portal code will be downloaded.
Example:
PowerPagesProjects
Run the following command:
pac org list
pac org select --environment
pac paportal download --path . --webSiteId
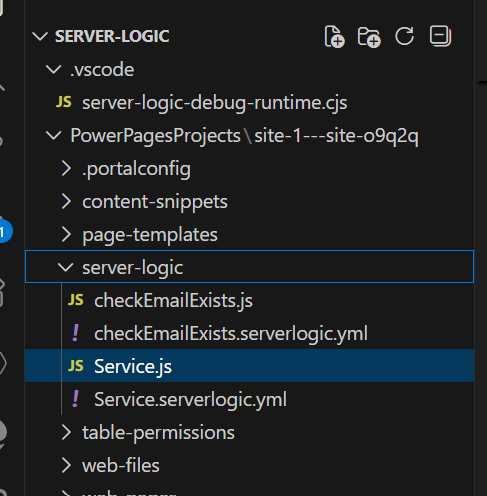
Once the download completes, your project structure will look like:
powerpages-site
│
├── web-pages
├── web-files
├── web-templates
├── site-settings
└── server-logic
Your server logic file will be located here:
 server-logic
└── Service.js
Open the downloaded folder in Visual Studio Code.
Navigate to:
server-logic
Open the file:
Service.js
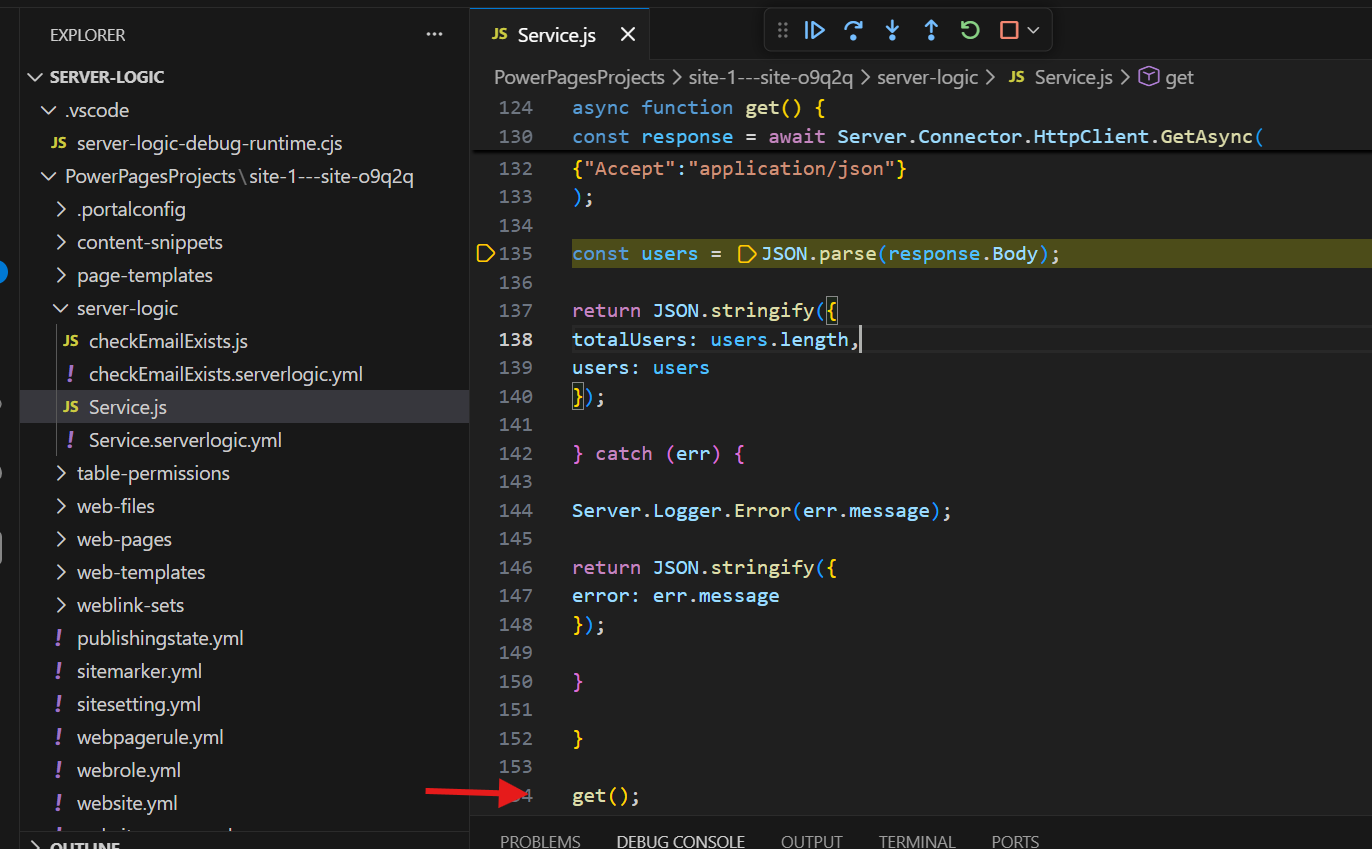
Paste the method name that you want to start debugging at the end of the server logic file.
Example: get();
This tells VS Code which function to execute during debugging.
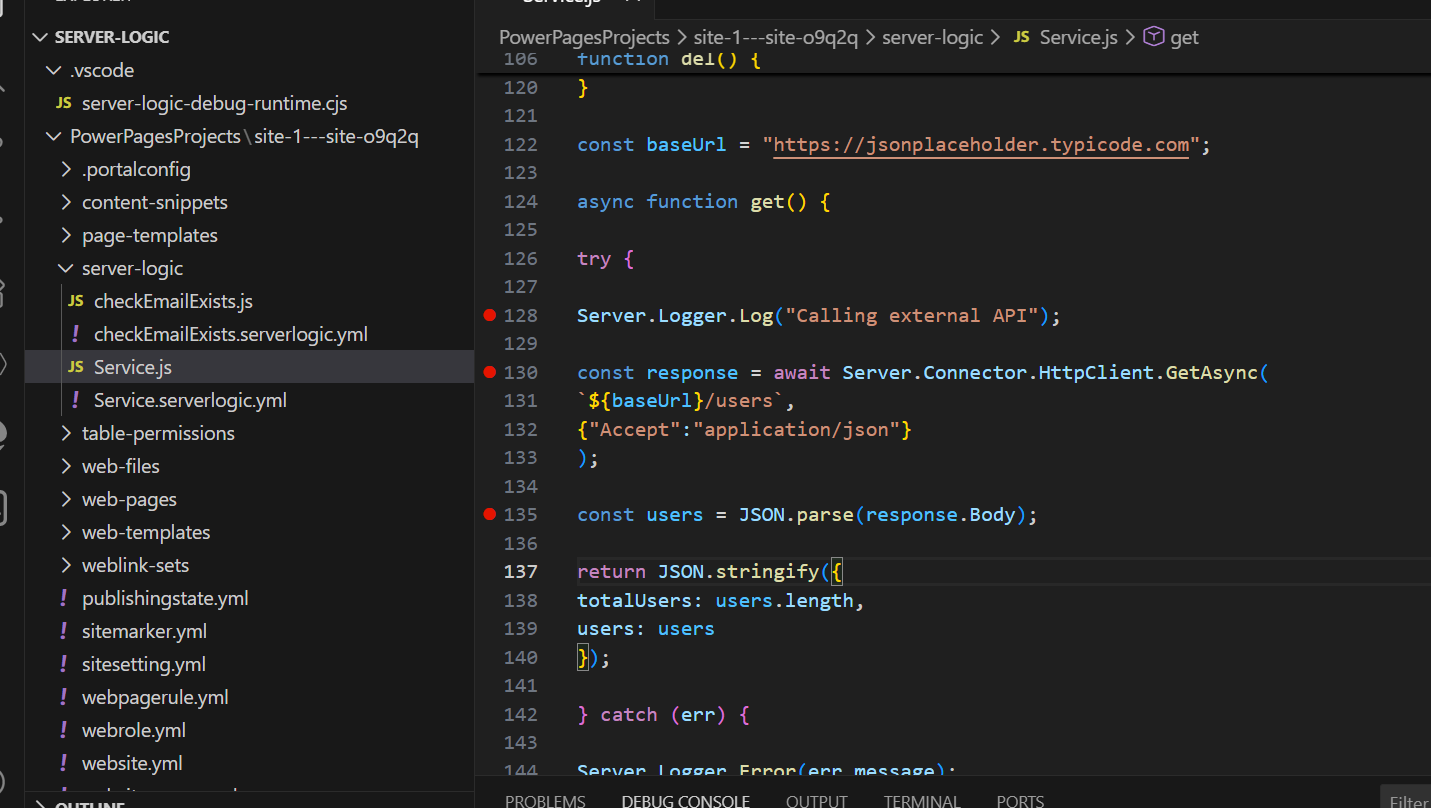
Breakpoints pause code execution so you can inspect variables.
Add breakpoints at these lines.
Server.Logger.Log("Calling external API");
Purpose:
Verify that the server logic execution begins.
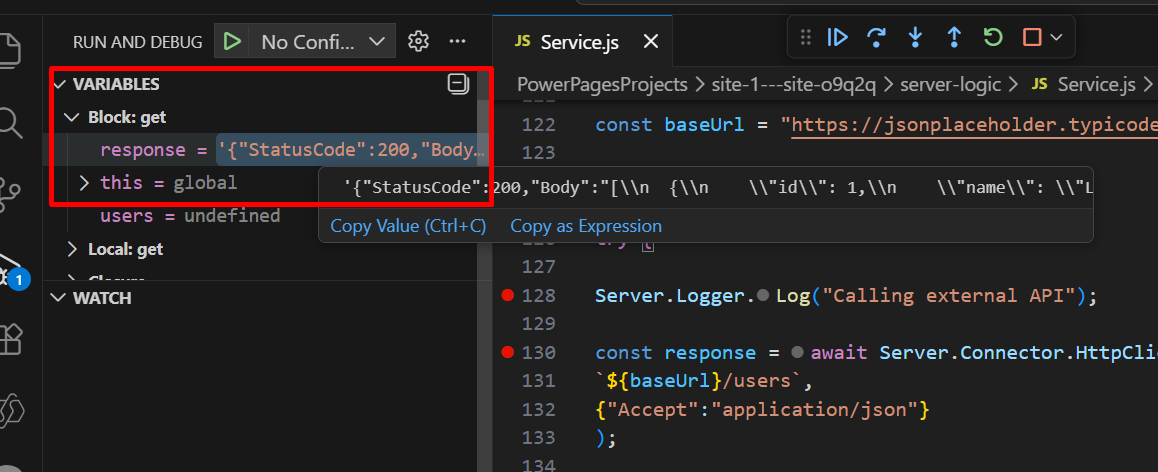
const response = await Server.Connector.HttpClient.GetAsync(...)
Inspect:
response.StatusCode
response.Body
Expected output:
StatusCode: 200
Body: JSON response
const users = JSON.parse(response.Body);
Inspect:
users
users[0]
Example:
{
id: 1,
name: "Leanne Graham",
email: "Sincere@april.biz"
}
Press:
F5
Visual Studio Code will start the debugger.
Click on Debug Current file.
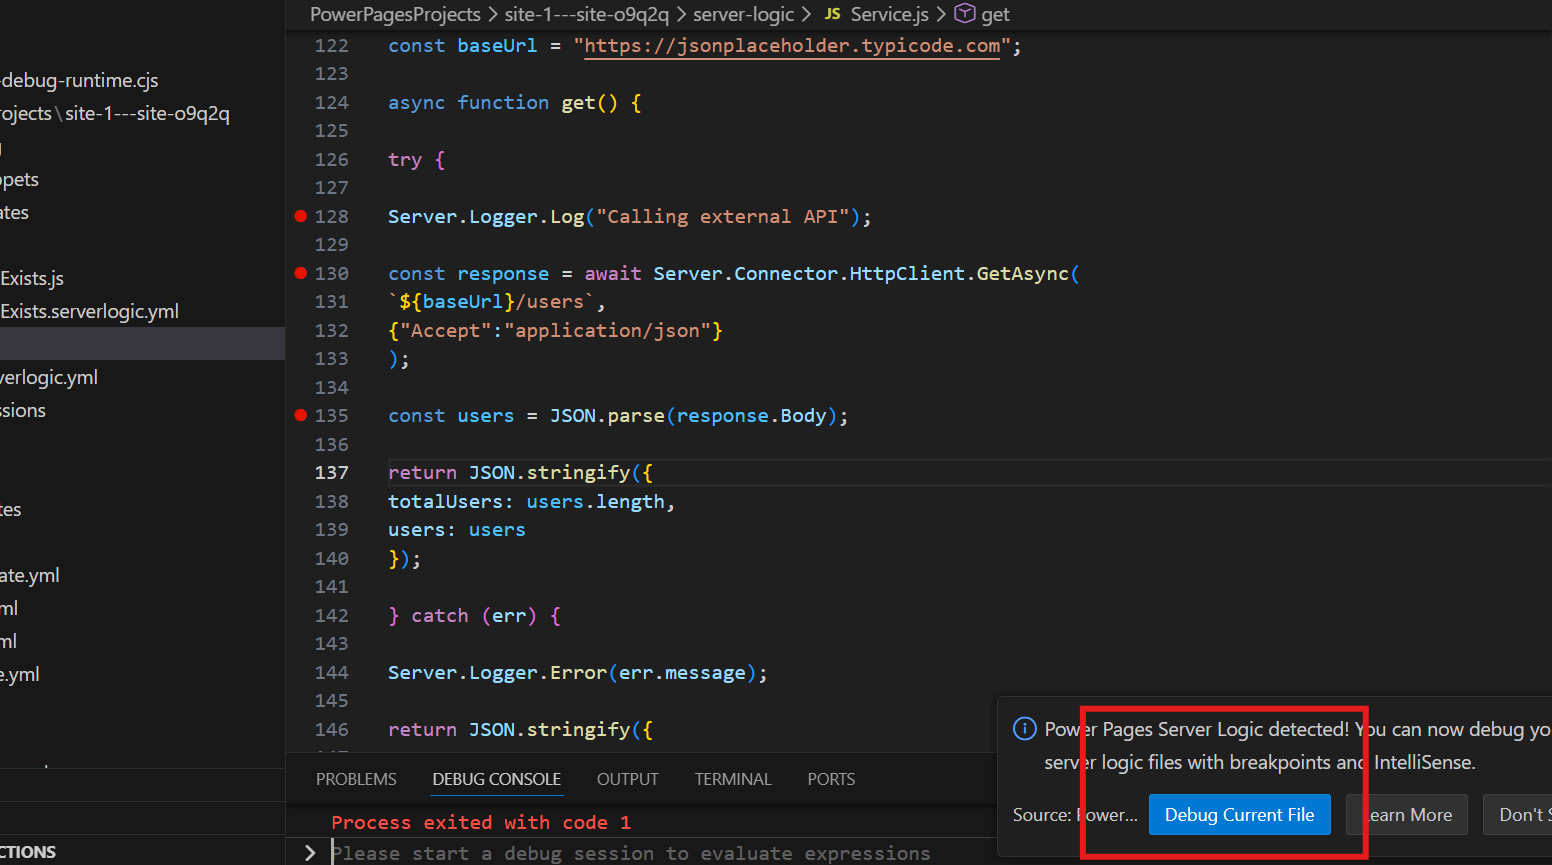
The execution will pause at the breakpoints you created, allowing you to inspect variables and step through the code.
Power Pages debugging uses a mock runtime environment
This means:
Server objects like Dataverse, Context, and User are simulated
External API calls using HttpClient work normally
Because of this, local debugging is mainly used to verify:
Logic flow
API integration
Code structure
Keep the following limitations in mind:
Local debugging does not connect to the live Power Pages runtime
Debugging works only in Visual Studio Code Desktop
Many server objects are mocked (simulated)
Results may differ from production behavior
Always test server logic in a development or test environment before production
Debugging Power Pages Server Logic locally with Visual Studio Code significantly improves the development experience. Developers can inspect variables, test API integrations, and validate logic without repeatedly deploying code to the portal.
Comment
There are certain things in a CRM project that a QA must validate or verify before any solutions gets deploy…
READ MORE
Building a Power Apps Code App is just the beginning. In real-world business applications, users often need to send emails,…
READ MORE
In this blog, we’ll build and deploy a Single Page Application (SPA) using React + Vite and host it on…
READ MORE